The number of marriages-divorces and marital status in the USA
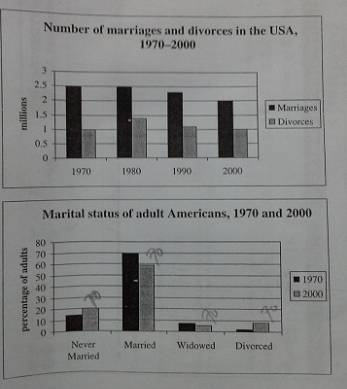
The two charts give information regarding the number of marriages and divorces in the USA from 1970 to 2000, whereas the second chart shows the number of marital status of adult Americans in 1970 and 2000 and it is measured in percentage.Generally, what stands out from the charts illustrate that the number of American people getting married and divorces shows a downward trend over the periods and married adult in USA was the highest percentage of marital status among others in both years, while the lowest number of marital status was the divorced in 1997.
...

TASK1_scoring7.PNG
I made some corrections, but also try to be more clear and specific. Try to break up your sentences more to be clear, you don't need to cram too much information into one sentence.
The two charts give information regarding marriages and divorces in the USA from 1970 to 2000. The first chart shows the number of marriages and divorces in ten year increments between 1970 and 2001. The second chart shows the division of adult Americans in four categories of marital status for the year 1970 and the year 2001.
What stands out from the first chart is that the number of American people getting married and divorced shows a downward trend over the time periods. The second chart shows that the highest percentage of adults in the USA in both years were classified as "married" , while the lowest percentage was in the "divorced" category in 1997 and "widowed" in 2000.
In regard to the first chart, in 1970, the number of marriages in the USA stood at 2.5 million of people which was higher than the number of divorces. This trend was unchanged in next period before the amount of American people getting married experienced a decrease in 1990 and 2000 at about 2.3 and 2 people million approximately. In contrast, at one million people in 1970, the number of divorces increased slowly to some 1.4 million people in 1980 before it reached one million in 2010.
Moving to a more detailed analysis, the second chart reveals that the "married" status was the highest percentage of all in both years. It was at 70% in 1970 and at about 59% in 2000 , followed by never-married as status as the second highest. While under 10%, widowed status in 1970 had a similar pattern with divorced status in 2000 at around 8% of marital status of adult Americans, and then divorced status in 2000 was the lowest of marital status in USA which was some 5% lower than the percentage of widowed status in 2000.
eddies [Contributor]
25 / 1170 Hi Guys, let me give you some feedback.
The word "generally" should be replaced with "overall" as the former one is more likely to be used in writing ielts task 2. When it comes to overview task 1 in particular, we use "overall" instead. This is the time to show an appropriate word if you think that you need to raise your LR.
If you have two main sentences running together, then putting and plus a comma is a must.
It is always good to write with linking words, but not too much. Try to train yourself not to use them seriously. Use reference words instead.
Thanks,
Eddy Suaib.
ⓘ Need academic writing help? 100% custom and human!

