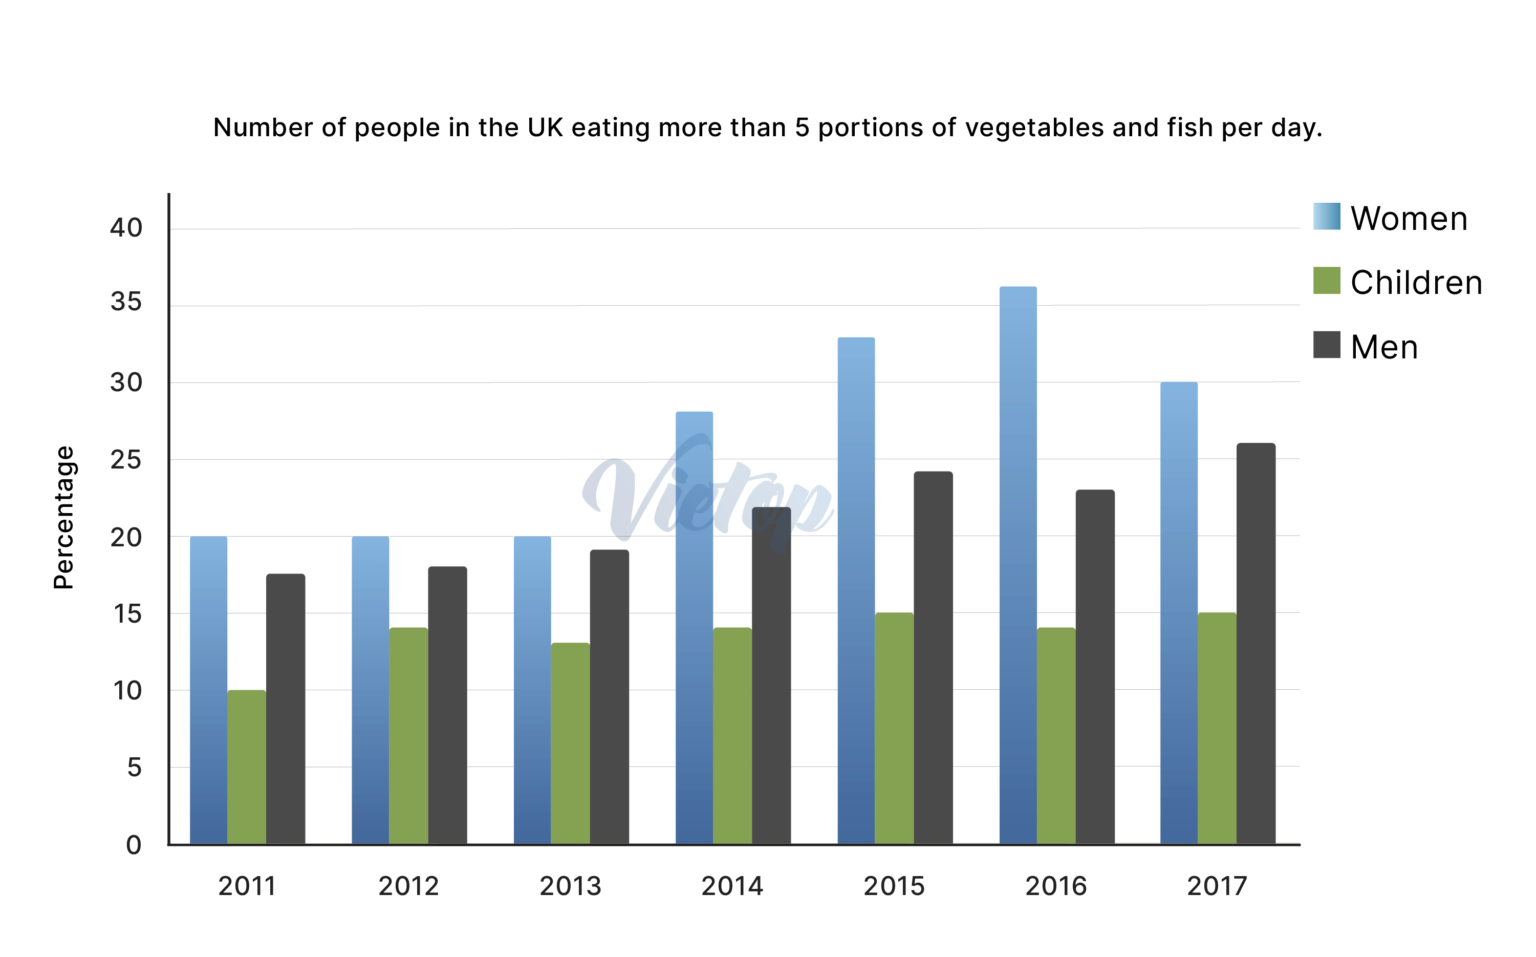
The bar chart illustrates the number of people in the UK eating more than 5 portions of vegetables and fish per day.
the chart gives information about the proportion of the English who consumed more than 5 portions of vegetables and fish daily, over a period of 6 years, starting from 2011.
overall, it is undeniable that although women had been keeping the record of having the highest consumption of these food every day, higher than children and men, and the second-largest eating these portions group of men
in 2011, it was witnessed that men account for about 18%, higher than children, and slightly lower than women. the english women had equal proportion from 2011 to 2013. in 2012, children and men made up 14% and 19%, respectively. In 2013 men was a slight increase, while the opposite was true for children.
it is record that men and women have upward trends, with the former rose significantly from just under 30% in 2014 to approximately 35% in 2015, and the latter grew slightly from 20% to 25%. Children had a equal percentage from 2014 to 2017. the proportion of women peak at 35% and drop slightly above 30% at the end, while men increase at 25% in 2017.
Summarise the information by selecting and reporting the main features and make comparisons where relevant.
the chart gives information about the proportion of the English who consumed more than 5 portions of vegetables and fish daily, over a period of 6 years, starting from 2011.
overall, it is undeniable that although women had been keeping the record of having the highest consumption of these food every day, higher than children and men, and the second-largest eating these portions group of men
in 2011, it was witnessed that men account for about 18%, higher than children, and slightly lower than women. the english women had equal proportion from 2011 to 2013. in 2012, children and men made up 14% and 19%, respectively. In 2013 men was a slight increase, while the opposite was true for children.
it is record that men and women have upward trends, with the former rose significantly from just under 30% in 2014 to approximately 35% in 2015, and the latter grew slightly from 20% to 25%. Children had a equal percentage from 2014 to 2017. the proportion of women peak at 35% and drop slightly above 30% at the end, while men increase at 25% in 2017.

GiaideIELTSWritin.png
