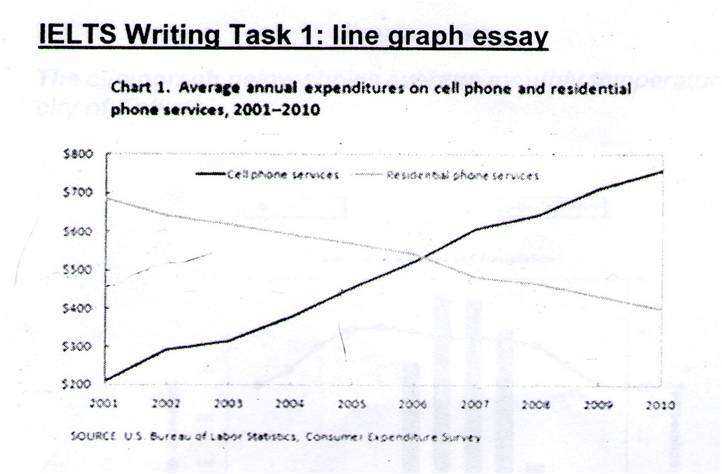
Given is the line graph presenting the overall spending on mobiles phone services and land line phone services throughout 2001 and 2010 in United States.
It is clear that expenditure cell phone services gradually increased. Opposite, spending on residential services fall steadily. The year 2006, consumer on mobiles overtook that for residential phones.
A closer look at the data reveals that in the first moment, an average of just over $200 rose quickly on expenditures of mobiles. By contras, consumers of residential services dropped slightly to just under $700. In around half decade, selling on cell phone increased dramatically to just above $450, while the figure of expenditure on land line phone services declined by nearly $200.
In 2006, on both on phone services outlaid the same figure at approximately $500 on each. In over the 10 years period, the average on cell phones had still risen around $750, while the figure on land line services had decreased to just over $400.

Picture1.jpg
