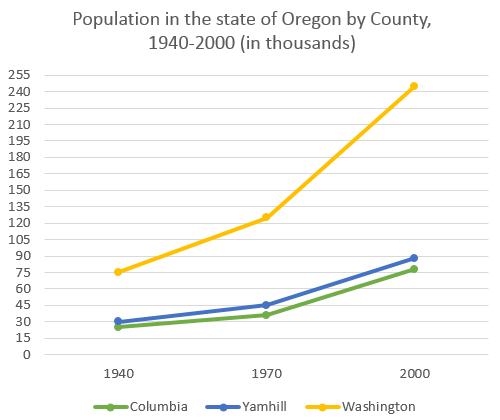
The graph below shows the population change between 1940 and 2000 in three different counties in the U.S. state of Oregon.
Summarise the information by selecting and reporting the main features, and make comparisons where relevant.
The line graph shows the number of population in three different countries in the United States of Oregon; Columbia, Yamhill and Washington during 6 decades, between 1940 and 2000, and it measures in thousands. It is clear that the population in three countries show a significant increase during the period.
The number of population in Columbia recorded the lowest in the state of Oregon, while the figure of Washington was the highest number of population 75,000 people in 1940. In terms of population, the number of population in Yamhill stood at the second position 30,000 people.
A more detailed look at the line graph shows that the number of Washington people inclined sharply from just over 120,000 people to above 240 thousand people between 1970 and 2000, a rise more than double the number of population. By contrast, the number of Columbian people experienced a steady incline, from approximately 25,000 people in 1940 to about 33 thousand people. Interestingly, the figure of population in Columbia and Yamhill had similar patterns which were a significant upward.

IELTS_Writing_Task_1.png
