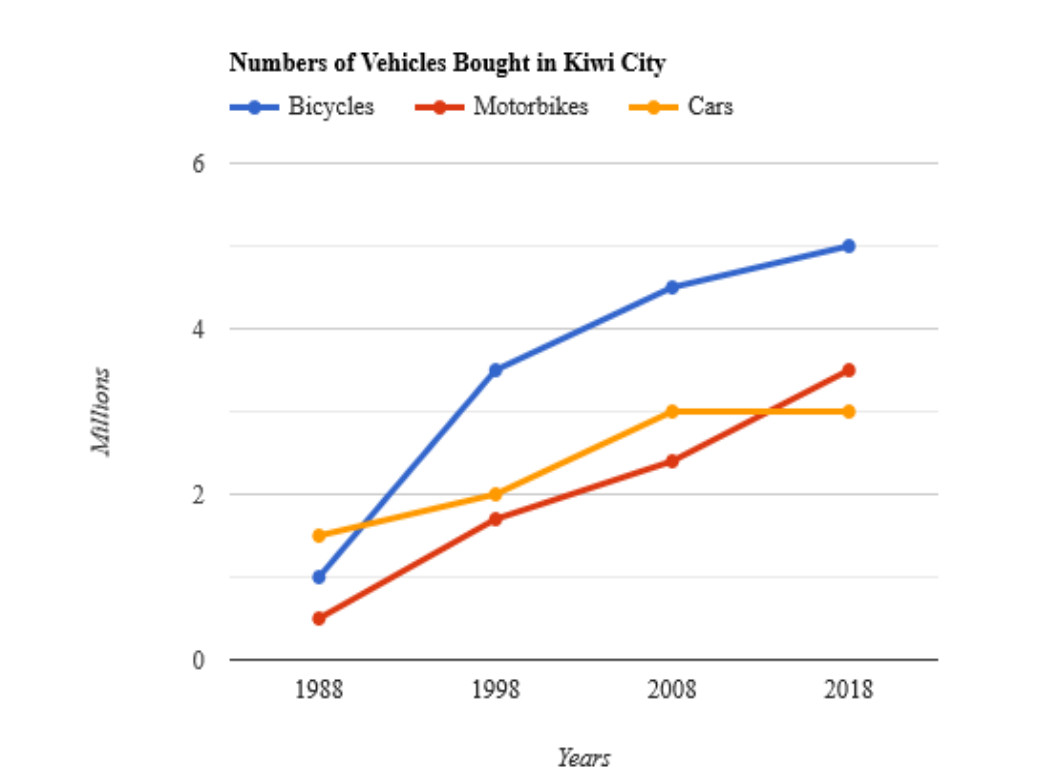
The line graph illustrates the number of vehicles purchased in Kiwi City from 1998 to 2018. The three types of vehicles considered are bicycles, motorbikes, and cars.
The overall trend shows that the number of vehicles bought in Kiwi City increased from 1988 to 2018. The number of bicycles bought increased the most, followed by the number of motorbikes bought. The number of cars bought remained relatively stable throughout the period.
In 1988, the number of cars bought was the highest, at 1.5 million. The number of bicycles and motorbikes bought was lower, at 1 million and 0.5 million, respectively. However, the number of bicycles bought increased from one million in 1988 to five million in 2018. The number of motorbikes bought had increased to 3.5 million, and car purchases had increased slightly to 3 million.
The number of bicycle bought was significantly higher than the number of motorbikes and cars bought throughout the period. In 2018, the number of bicycles bought was three times higher than the number of motorbikes bought and six times higher than the number of bicycles bought.
The line graph shows that the number of vehicles bought in Kiwi City increased from 1988 to 2018, with the number of bicycles bought increasing the most.

z4947680326052_975b3.jpg
