Need your advice about my report!!!!!
Task 1: Line Graph - Unemployment in US and Japan
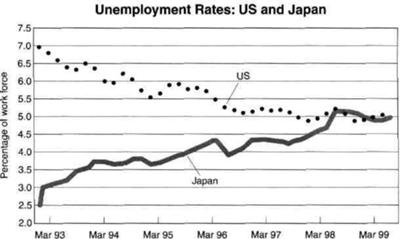
THE GRAPH SHOWS THE UNEMPLOYMENT RATES IN THE US AND JAPAN BETWEEN MARCH 1993 AND MARCH 1999.
MY REPORT:
The line graph illustrates the trend of unemployment in US and Japan between March 1993 and March 1999.
According to the picture it is clearly that there was a significant gap between unemployment rates in mentioned countries. But, the figures became approximately the same at the end of the period.
Starting from 2.5 unemployment rate in Japan increased gradually and peaked in late April 1996 at 4.4%.
After a slight decrease in May we observe the recovery at the end of 1996. The percentage of unemployed people in Japan increased just fewer than 10% and reached 5.3% the same percentage as in the US in May 1998.
The unemployment rate in the US decreased unevenly from 7.0% to 5.3% between 1993 and 1998. During the following year the unemployment rate declined at the beginning and rose at the end of 1999.
Overall, we see the opposite trend for unemployment in the US and Japan until May, 1998. After that there were the upward trends for both countries.

task1linegraphun.jpg
