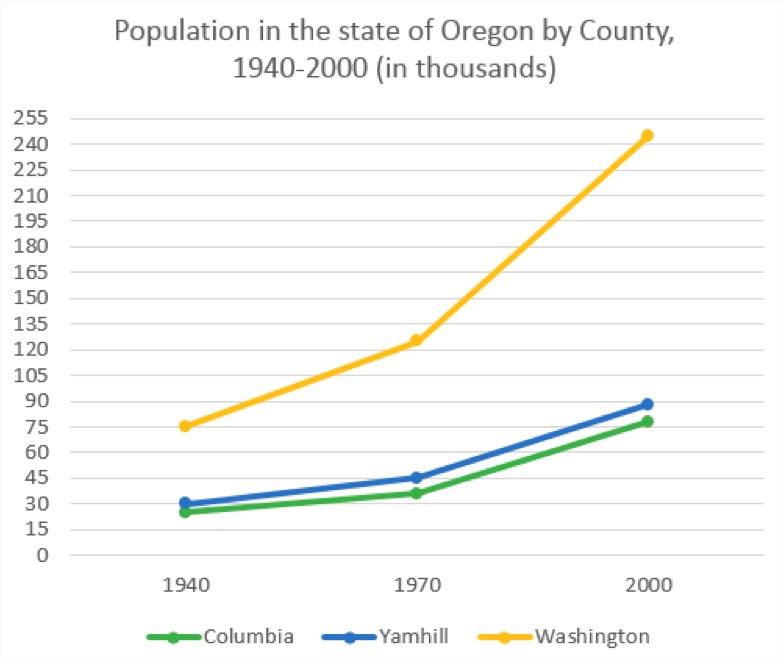
The graph below shows the population change between 1940 and 2000in three different counties in the U.S state Oregon.
The line chart exhibits the information about the number of population in three parts of Oregon which showed every 30 years starting from 1940 to 2000. At the first glance, Washington is the most crowded county whose population increase sharply during a 60-year period. However, the less favorite part for living in Oregon was Colombia.
At the beginning of year, the Oregon preferred to live in Washington. Its population was twice as much as Colombia and Yamhill. This trend was continuing during the period and the gap between Washington and Yamhill became bigger and bigger. It is because the Washington population was rocket sharply.
A more detail looked to the chart reveals that Colombia and Yamhill have under a third of Oregon population. They increased slowly to almost 90 thousand, but Yamhill slightly above Colombia. Furthermore, in 1940-to-1970 period, Colombia and Yamhill witnessed slower increase then 1970-to-2000 period. And it can be seen that Yamhill more favorite to stay than Colombia.
Oregon Population During Different Periods
The line chart exhibits the information about the number of population in three parts of Oregon which showed every 30 years starting from 1940 to 2000. At the first glance, Washington is the most crowded county whose population increase sharply during a 60-year period. However, the less favorite part for living in Oregon was Colombia.
At the beginning of year, the Oregon preferred to live in Washington. Its population was twice as much as Colombia and Yamhill. This trend was continuing during the period and the gap between Washington and Yamhill became bigger and bigger. It is because the Washington population was rocket sharply.
A more detail looked to the chart reveals that Colombia and Yamhill have under a third of Oregon population. They increased slowly to almost 90 thousand, but Yamhill slightly above Colombia. Furthermore, in 1940-to-1970 period, Colombia and Yamhill witnessed slower increase then 1970-to-2000 period. And it can be seen that Yamhill more favorite to stay than Colombia.

oregon_population.jp.jpg
