You should spend about 20 minutes on this task.
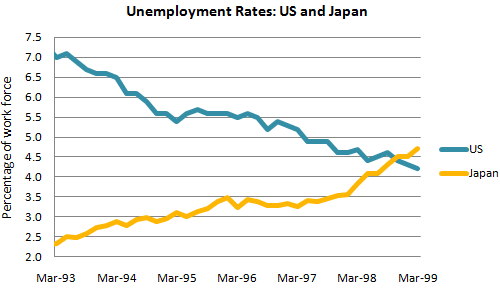
The graph below shows the unemployment rates in the US and Japan between March 1993 and March 1999.
Write a short report for a university lecturer describing the information shown below.
You should write at least 150 words.
The line chart compares the level of unemployment in the US and Japan over a period of 6 years.
Overall, it's clear that the unemployment rate in the US dropped from 7% to around 5% between 1993 and 1999 while the ratio of Japanese people in workforce but without an employment to all workfoce doubled during the same period.
. According to the chart, there was a decrease in unemployment figure by around 1,5% in the US during March 1993 and March 1996. Despite the plateau periods between 1994 and 1995, the rate of unemployment rose from 2,5% to over 4% over a period of 3 years.
On the other hand, there was a significant decrease in the percentage of unemployed people in the US between 1996 abd 1988 by %1 and thereafter, the figure stood over %4.75 during the following years. Over the same period, the level of unemployment increased from well over 4% to %5 in Japan even though the figure tended to decrease slightly in 1996 and 1998.
Word Count:171
Dear community, thank you for feedbacks.

g120.png
