Unanswered [2] | Urgent [0]
  

Home / Writing Feedback   % width   Posts: 4


People visiting nations - a line chart bellow by summarizing the information


maitrang95 2 / 2  
Feb 18, 2020   #1

Describe a line chart:


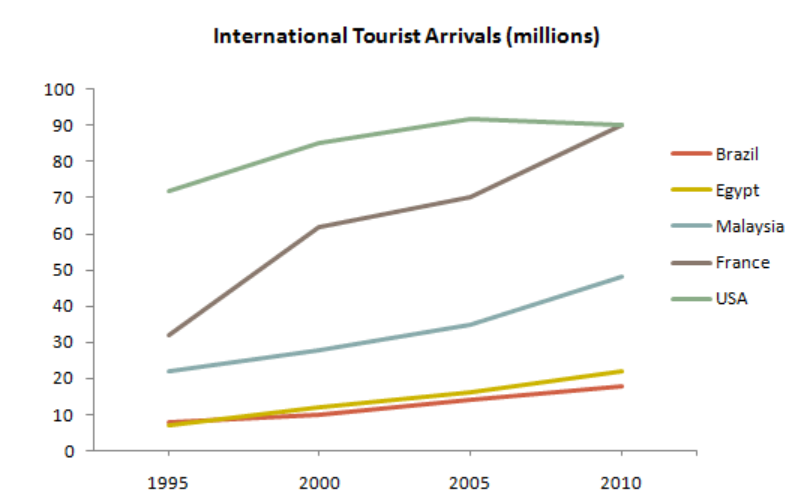
The line chart shows how many people visit to five nations in a fifteen-year period of time. In overall, the USA attracted tourists most whereas the number of people visit to Egypt and Brazil are low

At the beginning of the period, 70 million people spent their holiday in the USA which is higher about eight times, compared to the number of people visited to Egypt and Brazil. In two countries, namely France and Malaysia, the number of tourists are in a medium level, which are over 30 and 20 million respectively. The order still remained unchanged in 2000 with a slight increase in all the nations, except France. It witnessed a steep a growth from over 30 to 60 million people who stayed in France for their vacation.

The number of people came to these nations has been rising gradually and the USA as well as France were the most attractive nations. Brazil and Egypt were less lure than Malaysia when there were over 10 million people come to these nations. In the last year, it was a reverse increase in the USA and France. France had a rapid growth with over 80 million visitors. While there was a slightly increase in the number of tourists in Brazil and Egypt, Malaysia attracts nearly three times with over 30 million travelers

  • Test118.02.20.pn.png


vuthuylinh2611 19 / 61  
Feb 18, 2020   #2
Your essay is fairly good despite some grammatical errors: visit to -> visit; higher about eight time -> eight time higher. As I am not native and I have just started studying writing for IELTS, please refer to more comments from other writers.
Holt  Educational Consultant - / 15386  
Feb 18, 2020   #3
The summary overview is incomplete. It does not mention the measurement factor (in the millions). The trending statement was left as an open sentence as you failed to use a period at the end to indicate the close of the sentence. Do not use words of uncertainty and measurement assumptions in an essay that directly provides numerical data. You can only use the assumption presentation for graphs that do not indicate actual measurements or for measurements that fall between two numerical representations. Travelers is spelled with a double L (travellers). You also forgot to use a comma after an adverbial (million, respectively). I have to call your attention to the word count. 217 words for a task 1 essay is too much. You need to stop at the 200 mark so that you will have editing time within the 20 minute task. It is not enough to just complete the writing. It is more important to make sure that your essay meets all of the grading requirements so you can achieve the best score for your work. That is done by leaving an editing time of 5 minutes towards the end. So you 5 minutes to outline, 10 minutes to write, and 5 minutes to edit, revise, and finalize the copy.
OP maitrang95 2 / 2  
Feb 19, 2020   #4
Do not use words of uncertainty and measurement assumptions in an essay that directly provides numerical data

Can you explain this comment


Home / Writing Feedback / People visiting nations - a line chart bellow by summarizing the information
Need Writing or Editing Help?
Fill out one of these forms:

Graduate Writing / Editing:
GraduateWriter form ◳

Best Essay Service:
CustomPapers form ◳

Excellence in Editing:
Rose Editing ◳

AI-Paper Rewriting:
Robot Rewrite ◳

Academic AI Writer:
Custom AI Writer ◳