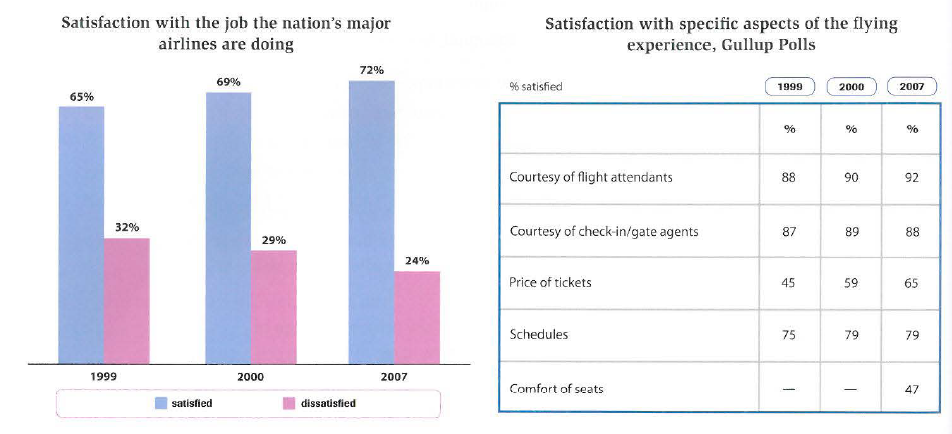
The chart and table below show customer satisfication levels in the US with airlines and aspects of air travel in 1999, 2000 and 2007.
Writing Task 1, Pratice Test, Page 130
The bar chart reveals the information regarding to customer satisfication with US airlines in 1999, 2000 and 2007. The tabel shows five different aspects that relate to customer satisfication during the same period. These datas are measured in the percentage. Overall, the most obvious facts are that satisfied proportion had a slight upward trend, while the figure of dissatified had a minimum downward trend. Moreover, people were really satisfied with courtesy of flight attendants
To begin with, the percentage of satisfied stood at more than three-fifths in 1999. It was followed by the increasing number of 7% during the last period to roughly 72%. In contrast, the largest starting level of dissatisfied was at 32% in 1999. There was a gradual fall in the percentage and bottomed at 24% in 2007.
On the other hand, the tabel shows that the percentage of satisfication for courtesy of flight attendants started at 88% in 1999 and rose slightly at 92% in 2007. However, the proportion of price of tickets inclined significantly by 20%, from 45% in 1999 to 65% in 2007. Meanwhile, the number of schedule remained unchanged over the last two-year. In contrast, the figure of courtesy of check-in/gate agents went up and down and the percentage of comfort of seat appeard firstly at 47% in 2007. (216 words)

289294_1_o.png
