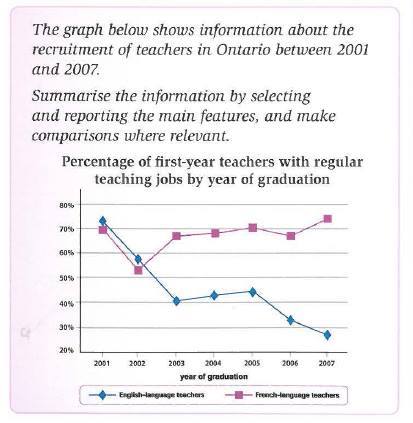
The line chart gives the percentage of new graduates who found jobs as teachers of English and French each year from 2001 to 2007. Overall, it can be seen that French teachers were more hired in Ontario than were English teachers although English teachers in 2001 were more than other language teachers at the same period.
At the beginning of period, teachers of both languages had approximately a 70% success rate in finding jobs. However, the next two years saw a slight decrease in French teachers at about 55 percent, and then increased by almost 70 percent, compared to English teachers which went down sharply by 30% to 40%.
2003 to 2005 experienced a stable rise in both French language teachers and English language teachers, from 68 to 70 percent and from 40 to 43 percent respectively. However, in the following year of graduation witnessed a significant difference between French teachers and English teachers who were hired. French teachers of 2007 were more finding jobs at over 70%, compared to English teachers which dropped sharply to below 30% in the same year.
(182 words)

student book 5-6 unit 3 writing 1
