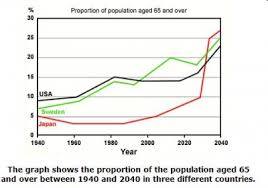
The Line Chart : The Proportion of Elderly People Population in Three Countries
A breakdown of the information about the proportion of aging people population during 1940 to 2040 in three different developed countries is illustrated in the line chart. Overall, despite having an upward trend, the proportion of elderly Japanese will overtake the place of the highest one in the last period.
According to the chart, in 1940, the percentage of elderly people in three countries showed a narrowed gap at around 5%. However in the next period, the proportion of aging people in Japan showed a decreased, while elderly people in USA and Sweden prevented a positive trend. Furthermore, between 1980 and 2000, the percentage of the old people in Sweden overtook the place of the highest one, while the proportion of aging people in USA decreased gradually during period. It was also followed by elderly Japanese which showed a positive trend.
Initially, during 2000 to 2020, while aging people in Japan and USA showed increased rates, the proportion of elderly Sweden's experienced the opposite rates. Finally, in 2040, the percentage of the old people in Japan will overtake the place of the highest one and reaches a peak rate. It is also followed by the proportion of aging people in Sweden and USA which shows an increasing level and reaches its peak.

Line_chart_2_Bulan_.jpg
