Unanswered [2] | Urgent [0]
  

Home / Writing Feedback   % width   Posts: 4


Task 1: the percentage of UK population following the radio and television (October-December 1992)


Vanphan 2 / 5  
Jul 26, 2021   #1

Uk dwellers and media


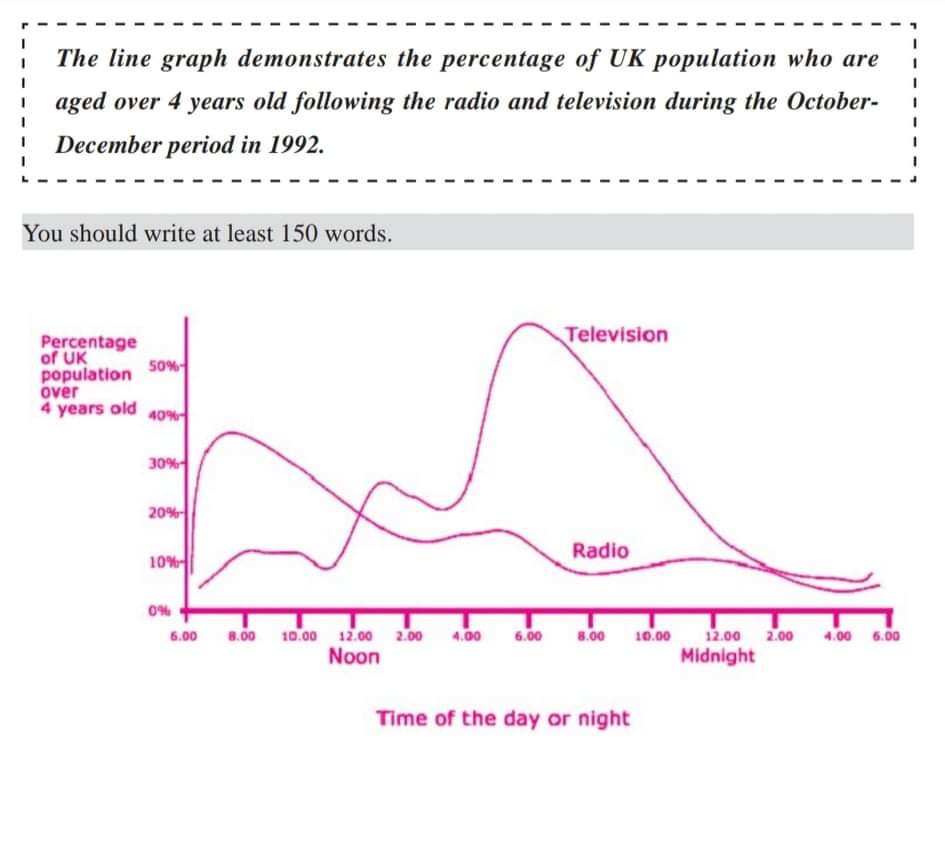
The line graph demonstrates the percentage of UK population who are aged 4 years old following the radio and televison during the octorber - december period in 1992

The figure illustrates the proportion of United Kingdom dwellers who are aged over 4 years old watching radio and broadcast media such as television throughout between October and December over a period of 1992 . Overall, it is noticed that there were mixed results of time about the change in how much time did childrens upper 4 years old follow radio and television , there was fluctuation significantly in the ratio of UK teenagers who watch television while the radio was a remarkable decrease from october to december.

Obviously, It is clearly seen that between 6:00 AM and 6:00 PM , people in UK were tend to follow television fluctuate and then reached a peak in 6:00 PM at upper a half , nearly doubling that of radio at 35% people who pay attention to and there was increase considerably occupies 25% at 6:00 PM , decline at 10% over 13 hours in 1992.

Apparently, in midnight , teenagers in United Kingdom were not toward radio attracted substantially and just remained stable between 8:00 PM and 6:00 AM and higher than the number of adolescent who pay attention to television the duration time and there was a rapidly decrease at 5%.

  • received_11483059855.jpeg


Holt  Educational Consultant - / 15386  
Jul 27, 2021   #2
The data presented includes false information about the measurement lbasis. The image and short report provided never indicated the inclusion of teenagers in the report. Regardless, the witten report makes several mentions of teenagers as a measurement basis or consideration. The essay is not task accurate due to this false information inclusion. Rather than specifically mentioning teenagers, a general non-age identifying population reference should have been used.

Image identification is inaccurate as well. Task 1 essays all have "figures" provided. It is the type of image that must be properly identified ( line graph, bar chart pie chart, instructional illustration...). The task fulfillment of this report is really problematic and could very well cause a failing score.
Mio_phoenix 1 / 3  
Jul 27, 2021   #3
"People in the UK were tend... fluctuate and then reach..." This sentence has 2 verbs, "were tend" (actually, "tend" is a verb so I don't think it goes with "were") and "fluctuate". I think you can write "People in the UK tending... fluctuated..."
Kiu1007 3 / 5  
Aug 3, 2021   #4
The introduction should paraphrase the topic instead of copy it.
Such as use "illustrates" "shows" "indicates" instead of demonstrates.
The percentage of UK population could be replaced by "the rate of UK citizens using television and radio during October to December in 1992"
and from the graph shown that this graph is on a daily basis, so it could be included in the topic.
And you could try using "watch television" and "listen to radio" instead of using "tend to follow television".


Home / Writing Feedback / Task 1: the percentage of UK population following the radio and television (October-December 1992)
Need Writing or Editing Help?
Fill out one of these forms:

Graduate Writing / Editing:
GraduateWriter form ◳

Best Essay Service:
CustomPapers form ◳

Excellence in Editing:
Rose Editing ◳

AI-Paper Rewriting:
Robot Rewrite ◳

Academic AI Writer:
Custom AI Writer ◳