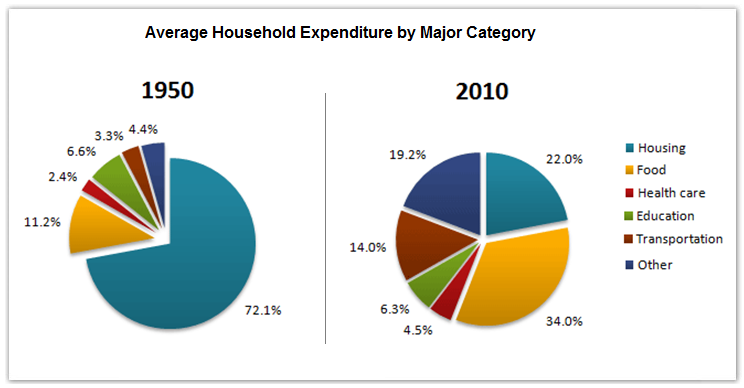
A breakdown of the proportion of money spend in household from 1950 to 2010 as a projected years, a 6-decade period in a country is presented in the pie charts. Overall, the majority of 50's people spent their money on housing, while in 2010, food was the essential part to fulfill.
By 1950, the inhabitants had allocated just over seven in ten of their money to housing, while the percentage of spending money on food was almost seven times lower than of this. However, other parts were not the focus of the people to spend their income with, because the figures solely stood at no more than 7%.
In the next six decades, the percentage of expending money to housing witnessed a dramatic fall. The figure finished at 22%, while the proportion of people buying food increased more than three times, to almost more than a third. Transportation and other also experienced a sharp rise to 14% and 19.2% respectively, while health care and education were still in the lowest position.

IELTS_Academic_Writi.png
