This is my essay for IELTS Writing Task 1. I would be grateful if someone here sends me some comments.
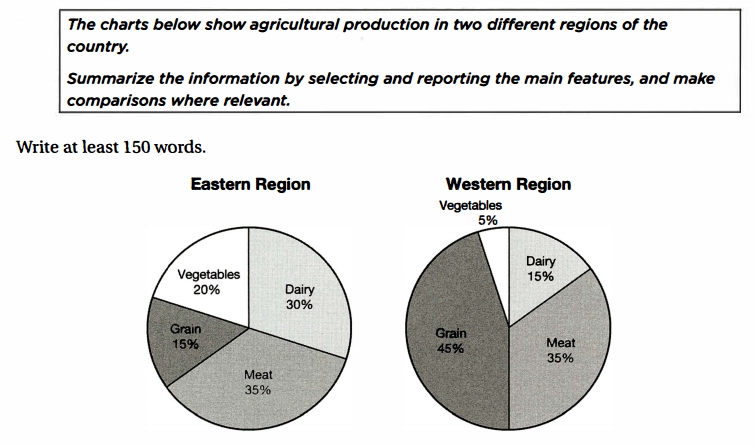
The pie charts compare the production of various agricultural products between two areas of the country. Each region develops different major food.
In the East of the country, meat is the most popular product with thirty-five percent of production. The second highest percentage is dairy, with thirty percent of total agricultural production is produced for consumption. A fifth of the total is vegetables, while fifteen percent of production is for grain harvesting.
In Western region, on the other hand, considerably more grain is produced, with forty-five percent of total production, three times as many as in the East. Meat is one of the top two most popular products besides grain, with thirty-five percent of production, the same as in Eastern area. There is a difference in percentage of milk products between milk products. Fifteen percent of Western agricultural production is dairy, which is equal to a half of the Eastern dairy amount. A very small part of the total production is for vegetables producing, with only five percent.
In general, each area concentrates on different products. While the agricultural commodities is distributed relatively equaled in the East, Western region seems to prefer grain.
(193 words)
IELTS Writing Task 1 - Agricultural Producion
The pie charts compare the production of various agricultural products between two areas of the country. Each region develops different major food.
In the East of the country, meat is the most popular product with thirty-five percent of production. The second highest percentage is dairy, with thirty percent of total agricultural production is produced for consumption. A fifth of the total is vegetables, while fifteen percent of production is for grain harvesting.
In Western region, on the other hand, considerably more grain is produced, with forty-five percent of total production, three times as many as in the East. Meat is one of the top two most popular products besides grain, with thirty-five percent of production, the same as in Eastern area. There is a difference in percentage of milk products between milk products. Fifteen percent of Western agricultural production is dairy, which is equal to a half of the Eastern dairy amount. A very small part of the total production is for vegetables producing, with only five percent.
In general, each area concentrates on different products. While the agricultural commodities is distributed relatively equaled in the East, Western region seems to prefer grain.
(193 words)

Pie.jpg
