Hi all, I have just started writing IELTS task 1, please help me to correct and evaluate band score. Thanks in advance!
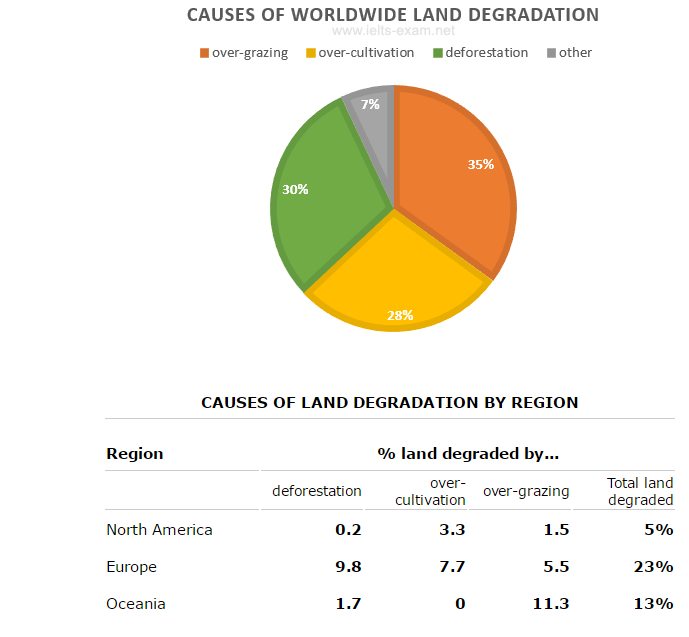
The pie chart below shows the main reasons why agricultural land becomes less productive. The table shows how these causes affected three regions of the world during the 1990s.
Summarise the information by selecting and reporting the main features, and make comparisons where relevant.
The pie chart depicts the main three reasons: overgrazing, over-cultivation, deforestation which led to the degradation of agriculture in the 1990s. The table illustrates three regions, North America, Europe and Oceania suffered land degradation from those reasons. Overall, as we can see that the percentage of over-grazing is the highest, and Europe experienced land degradation most.
Looking at the first chart, 35% of land degradation due to overgrazing; deforestation followed, accounting for 30% of land degraded. Moreover, there was a major percentage of 28% of farmland degradation caused by over-cultivation, while only 7% of other reasons made agriculture becomes less productive.
Turning to the second chart; it is clear that Europe had the highest percentage of land degraded, at 23% in total with 9.8% of land affected due to deforestation, 7.7% due to over-cultivation and 5.5% affected from over-grazing. In contrast, North America suffered the lowest percentage with 5% of land degradation in total, 3.3% of land degraded caused by over-cultivation, while 0.2% and 1.5% of land degradation due to deforestation and over-grazing respectively. Regarding Oceania, there was 13% in total of degrading farmland on this continent, therein 11.3% of land affected from animal grazing compared to 1.7% of land impacted from deforestation.

download.png
