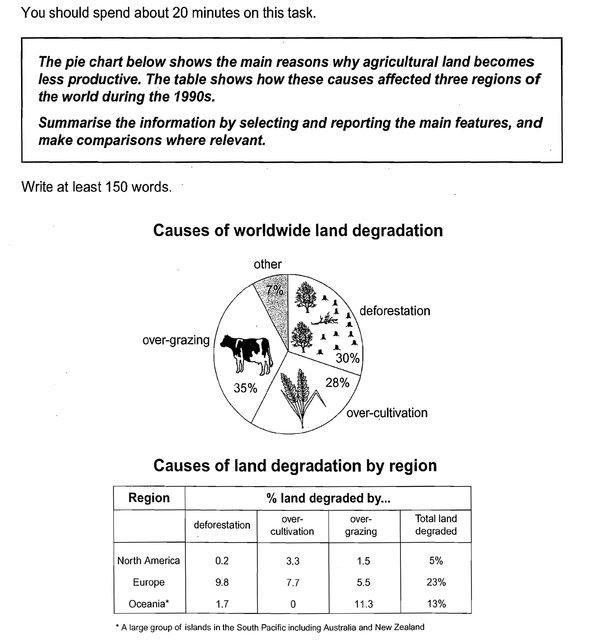
The pie chart illustrates the causes of land degradation in worldwide and the table indicates the differences in causes of land degradation by three regions: North America, Europe, and Oceania which is a large group of island in the South Pacific, including Australia and New Zealand. At first glance, it can be seen that over-grazing is a major cause of land degradation in worldwide and in North America by over-cultivation, in Europe by deforestation, and in Oceania by over-grazing.
The pie chart shows that over-grazing represented 35% of the total causes. Furthermore, land degradation was caused by deforestation amounts 30%, or three-tenths and over-cultivation by 28%. Turning to the table, in North America, only 5% of the land degradation, which over-cultivation accounted for 3.3%. However, land degradation in Europe by 23%, or close to a quarter, where deforestation became a major cause. Oceania had only two causes of land degradation. There were deforestation and over-grazing, which over-grazing had the greatest percentage, more than one-tenth.
The pie chart shows that over-grazing represented 35% of the total causes. Furthermore, land degradation was caused by deforestation amounts 30%, or three-tenths and over-cultivation by 28%. Turning to the table, in North America, only 5% of the land degradation, which over-cultivation accounted for 3.3%. However, land degradation in Europe by 23%, or close to a quarter, where deforestation became a major cause. Oceania had only two causes of land degradation. There were deforestation and over-grazing, which over-grazing had the greatest percentage, more than one-tenth.

essay50210.jpg
