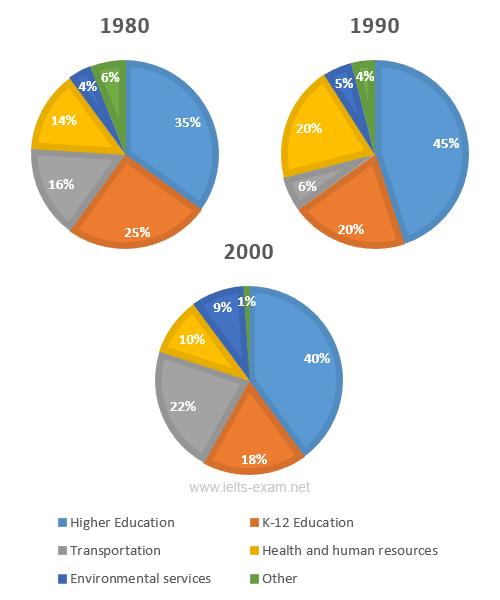
The Pie charts represents the precentages of changes in the annual dependent such as Higher Education, Transportation, Environmental Services, K-12, Health and Human Resources and Others by local government in several lands between 1980, 1990, and 2000. All in all, higher education was the highest precentage from start point until the last period. However, others in the following years significantly decline.
In 1980 until 1990, higher education was the highest precentage from 35% to 45% and at 2000 decreased became 40%. Transportation in 1980 was 16% and decreased became 6% in 1990, but in the end period was increase became 22%.
Every periods, environmental services always increased respectively from 4%, 5%, to 9%. K-12 Education had a decrease trends in every years, from 25%, 20%, to 18%. Health and Human Resource had a some trends with higher education that increased in the middle years from 14% to 20% and decreased at the end period became 10%. In 1980, others was 6% and the following years decreased from 4% to 1%.

