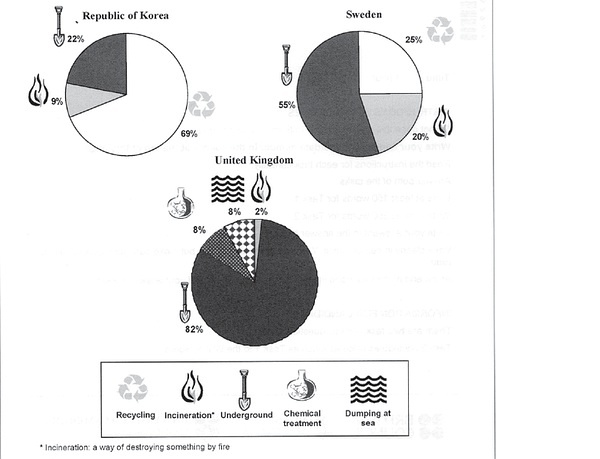
The pie charts below show how dangerous waste products are dealt with in three countries.
Summarize the information by selecting and reporting the main features, and make comparisons where relevant.
The pie charts are presented for analysis of the disposal methods of hazardous waste materials employed in three countries - Korea, Sweden and the UK. Each figure represents a country in the list. In the essay, I will summarize the destinations of waste and make comparisons between the states wherever needed.
The bulk of dangerous waste is buried on land in the UK and Sweden, while waste recycling is strongly preferable in Korea. The technique is also employed on a modest scale in Sweden but does not come into use in the UK, the only country to dump waste materials at sea or treat them with chemical products. As to incineration, it is a fairly common treatment process in Sweden but rarely used in the others.
As an insight into the details, 82% of dangerous waste products end up in landfills in the UK, compared with 55% in Sweden and 22% in Korea. 69% of dangerous waste products are recycled in Korea, much higher than 25% in Sweden. The figure is even lower in the UK that does not recycle materials of this kind.
With regard to the treatments unique to the country, 8% of dangerous waste products are subject to chemical treatment and as many are dumped at sea. It burns roughly the same percentage of waste as Korea does, 2% versus 9%. In Sweden, however, as much as 20% of dangerous waste products are reduced to ash.
I would more appreciate it if you score my essay,
I have a question: in my third and fourth paragraphs, I uniformly used "dangerous waste products" to match "the percentage of"(82% of..., 69% of... etc.). Some textbooks recommend replacing "dangerous waste products" with similar expression including "hazardous waste products" and "waste materials" for language variety. Is the replacement necessary?
I sticked to "dangerous waste products", since I found a report from the U.S. Energy Information Administration (EIA), in which only "...% of U.S. electricity generation" is used.
eia.gov/energyexplained/index.cfm?page=electricity_in_the_united_states
Summarize the information by selecting and reporting the main features, and make comparisons where relevant.
Toxic waste
The pie charts are presented for analysis of the disposal methods of hazardous waste materials employed in three countries - Korea, Sweden and the UK. Each figure represents a country in the list. In the essay, I will summarize the destinations of waste and make comparisons between the states wherever needed.
The bulk of dangerous waste is buried on land in the UK and Sweden, while waste recycling is strongly preferable in Korea. The technique is also employed on a modest scale in Sweden but does not come into use in the UK, the only country to dump waste materials at sea or treat them with chemical products. As to incineration, it is a fairly common treatment process in Sweden but rarely used in the others.
As an insight into the details, 82% of dangerous waste products end up in landfills in the UK, compared with 55% in Sweden and 22% in Korea. 69% of dangerous waste products are recycled in Korea, much higher than 25% in Sweden. The figure is even lower in the UK that does not recycle materials of this kind.
With regard to the treatments unique to the country, 8% of dangerous waste products are subject to chemical treatment and as many are dumped at sea. It burns roughly the same percentage of waste as Korea does, 2% versus 9%. In Sweden, however, as much as 20% of dangerous waste products are reduced to ash.
I would more appreciate it if you score my essay,
I have a question: in my third and fourth paragraphs, I uniformly used "dangerous waste products" to match "the percentage of"(82% of..., 69% of... etc.). Some textbooks recommend replacing "dangerous waste products" with similar expression including "hazardous waste products" and "waste materials" for language variety. Is the replacement necessary?
I sticked to "dangerous waste products", since I found a report from the U.S. Energy Information Administration (EIA), in which only "...% of U.S. electricity generation" is used.
eia.gov/energyexplained/index.cfm?page=electricity_in_the_united_states

p27019199.jpg
