Unanswered [1]
  

Home / Writing Feedback   % width   Posts: 2


IELTS Writing Task 1 about how the population component in Australia varies through a period of 15 y


cchauaim8 1 / -  
May 5, 2023   #1

the percentage of people who were born inside and outside Australia


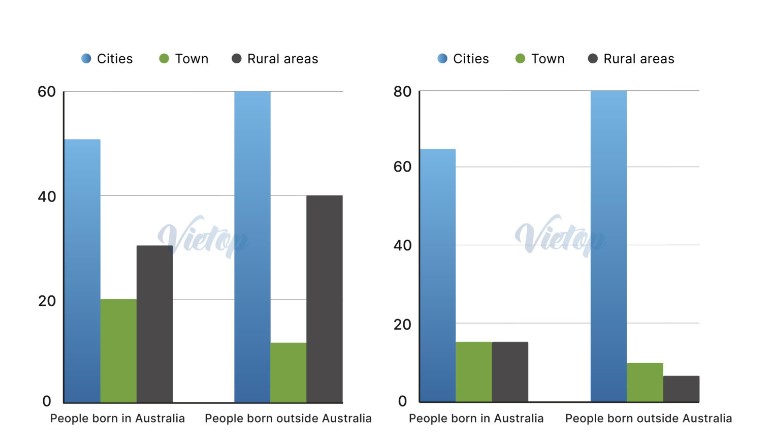
The illustrated bar charts delineate how the population component in Australia varies through a period of 15 years, categorized by administrative areas.
As clearly described, the total number of residents experienced a climb from 1995 to 2010 when the largest percentage rose from 60% to 80%. However, a noticeable feature that remained stable was that the non-native Australian rate was much higher than the native ones.

In addition, there was a contrasting trend in the population distribution. In particular, citizens from both aspects (who were born inside and outside Australia) favored living in cities more than ever. The number of non-native people increased by half. On the contrary, the proportion of residents who chose suburban regions as places to live declined substantially. Specifically, this group of people only accounted for under one-fifth of the total population in the latter period. For the ones who were not born in Australia and lived in the countryside, the proportion was reduced four times, from exactly 40% to below 10%.

  • Screenshot2023050.jpg


Holt  Educational Consultant - / 15460  
May 5, 2023   #2
The illustrated bar charts

The bar chart is already a drawing of a measurement set. Next time, identify the type of chart instead. Is it a columnar or row chart? What information is divided within it?

Focus on summary clarity in your first paragraph. Do not forget the cardinal rule of sentence writing. One idea per sentence. Long sentences composed of combined ideas are run on presentations that are going to receive GRA + C&C deductions. It could result in a preliminary failing score.

Make sure to focus on the correct overall format as well. The way this essay is presented counts only 2 out of the required 3 analysis paragraphs. That will result in TA deductions as well.

While you used alternative measurements relatively well, the lack of numerical references of any sort does not leave the reader properly informed. Hence, heavy deductions will be applied to the C&C sections.


Home / Writing Feedback / IELTS Writing Task 1 about how the population component in Australia varies through a period of 15 y
ⓘ Need Writing or Editing Help?
Fill out one of these forms for professional help:

Best Writing Service:
CustomPapers form ◳

Graduate Writing / Editing:
GraduateWriter form ◳

Excellence in Editing:
Rose Editing ◳

AI-Paper Rewriting:
Robot Rewrite ◳