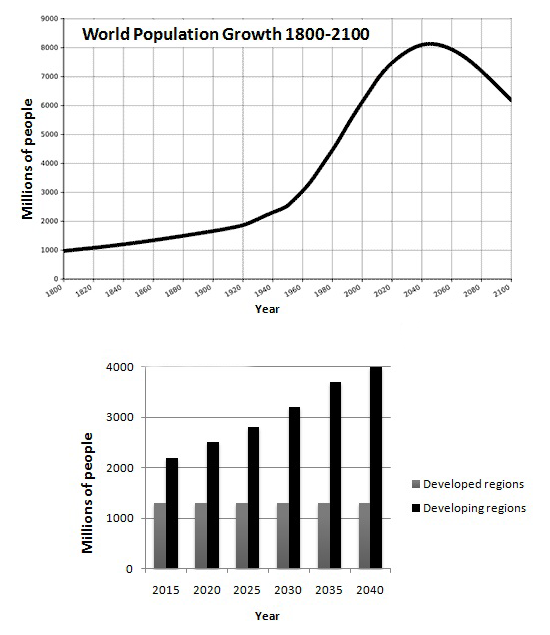
The line chart shows the numbers of world population in millions growth during particular year from 1800 to 2100, while the bar chart compares the prediction of the two regions growth between 2015 and 2040.
Overall, the proportion of population growth in developing regions is far higher than the proportion in the developed regions, while the undeveloped numbers of population occurs in developed regions. Instead, the world population growth experiences a tremendous increase before predict will be fell slightly from 2040 onwards.
According to the line chart, there was the lowest rate of population by 1000 millions of people. This trend experienced a gradual increase then threefold in 2000. After a short peak period in 2040, the figures will be predicted a slight decrease in the end of statistic.
A closer look at the bar chart predicts the population in developed regions will remaining stable over 25 years statistic. Standing in contrast with the developed regions, the prediction of population growth in developing regions will be climbed gradually. Appearing by more than 2000 millions of people in 2015, the figures predict more doubled to reach the top notch population by 4000 millions of people in 2040.

221531_1_o.png
