Writing - IELTS Task 1 - Line graph
Hi everyone! I'm a new member. I'm practicing for ielts but my english is not really good. If you are not busy, please help me find out some mistakes that I have made, thanks for all ^^
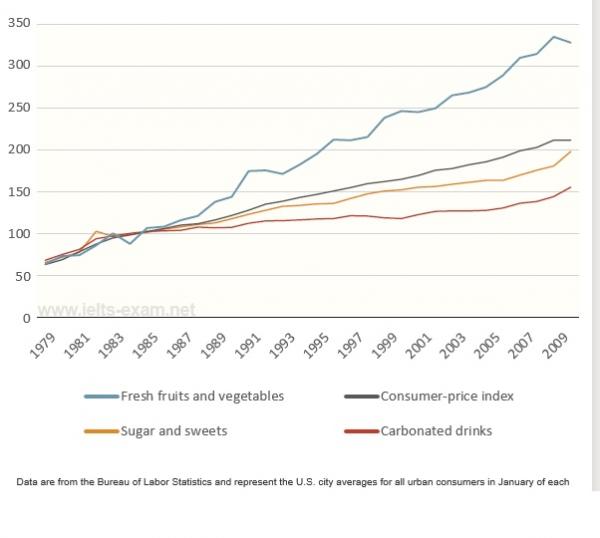
[The graph above shows relative price changes for fresh fruits and vegetables, sugars and sweets, and carbonated drinks between 1979 and 2009 in the US]
My writing:
The line graph provides information about changes in prices of three different food product groups, and the overall trend of Consumer-price index from 1979 and 2009 in the US.
Overall, it is clear that the prices increased in all the three food product groups and fluctuated slightly over 30 years. Only the price for fresh fruits and vegetables were significantly higher than the Consumer Price Index.
In the first year 1979, all lines of the graph had a same figure at approximately 60. Over the period, the Consumer-price index went up gradually to over 200 in 2009. The prices for sugar and sweets and carbonated drinks had the similar upward trend. However since 1987, they were consistently below the CPI throughout the remainder of the period. Finally, the figure for carbonated drinks stood at 150, which was lower than the figure for sugar and sweets at 200 in 2009.
Prices for fresh fruits and vegetables, which had the same stating figure of 60 in 1979, had risen steadily with a few fluctuations before reaching at roughly 330 by the year 2009.

task_1_4.jpg
