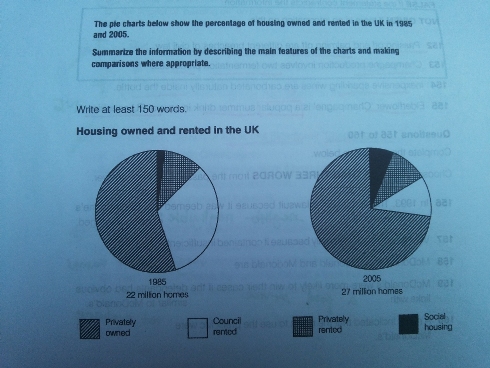
The pie charts below show the percentage of housing owned and rented in the UK in 1985 and 2005.
Summarize the information by describing the main features of the charts and making comparisons where appropriate.
The pie charts compare the proportion of accommodation types in the United Kingdom which is collected in 1985 and 2005. Overall, it is noticeable that, there has been an increase of five million residences over a two-decade period. Furthermore, the number of council rented housing saw a negative trend while the other three cohorts experienced a considerable growth during the period.
In 1985, there was a significant proportion in the number of privately owned blocks, roughly 55 percent from 22 million homes. It inclined dramatically to approximately third-quarter of 27 millions twenty years later. On the other hand, the figure for council rented saw a sharp fall, from nearly 30 percent to 15 percent in 2005.
There was a huge gap between the percentage of social housing and privately rented houses initially. Social housing began at a very small number, at 5 percent, and 10 percent for privately rented groups. Then, both categories represented a fairly equal proportion, at one in ten, at the end of the time frame.

Housing_owned_and_re.jpg
