Unanswered [1]
  

Home / Writing Feedback   % width   Posts: 3


IELTS 1. The proportion of four different age groups in the total population of New Zealand


huong1212131 1 / 1  
Dec 22, 2021   #1

the percentage of New Zealand population 1950 - 2050


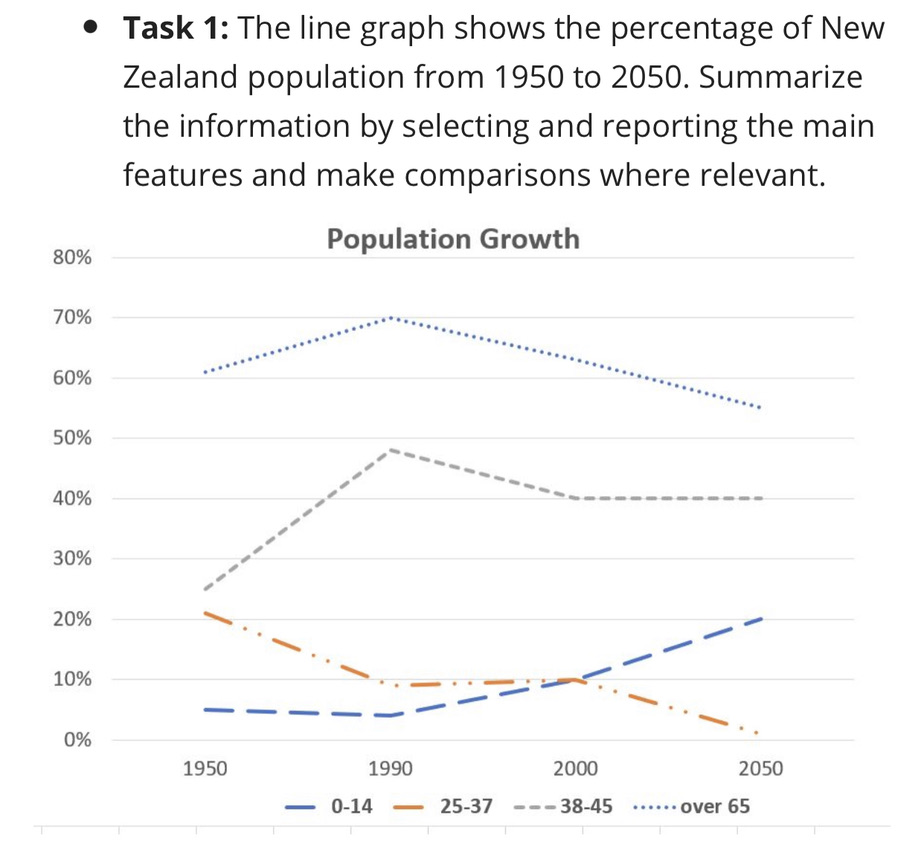
The given graph illustrates the proportion of four different age groups in the total population of New Zealand in 1950,1990,2000 and the estimation of 2050.
Overall, there is a decline in the percentage of people from 25 to 37 while the opposite trend was seen in others. In addition, the people of age over 65 consistently have the largest figures throughout the period, even though a considerable decrease was seen in the latter of the period.

In 1950, the percentage of senior citizens started at 60%, after which it saw a gradual rise to reach its peak at 70% in 1990, before declining to about 63% 10 years later. Similar changes, but to a lesser extent, were seen in the figure for people from 38 to 45, which grew from roughly 25% to almost 50% then decreased to precisely 40% in 2000. 5% of infants and teenagers lived in New Zealand in the first 40 years, with a significant increase to 10% in 2000. Meanwhile, opposite changes can be seen in the figure for people from 25 to 37, which decreased steadily from over 20% to exactly 10% in 2000.

By 2050, the population of people aged over 65 and from 25 to 37 is expected to drop at the same rate, reaching 55% and 0% respectively. By contrast, the figures for the young will increase by 10 percent whereas the middle-aged is predicted to maintain stable at 40%.

  • line graph


Holt  Educational Consultant - / 15460  
Dec 23, 2021   #2
four different age groups

Specified as? Kindly give importance to every summarized aspect of the presentation. Each information piece you share should be highlighted in its own sentence to help the reader avoid information confusion. Information confusion normally occurs when more than 1 idea is shared per sentence. This is commonly known as a run-on sentence.

from 25 to 37

age over 65

Do not included specific information in the trending section. These should be presented as general observations, with the full data reference being provided in the reporting, analysis, and comparison paragraphs. This trend is good, but should have avoided direct information references. You can be vague in this reference area.

Overall, the analysis appears to be well thought out and developed. However, the writer could learn how to write shorter comparative sentences to save on draft writing time. More time should be spent on the proofreading and finalization of the analytical report. Good job just the same.
OP huong1212131 1 / 1  
Dec 23, 2021   #3
The given graph illustrates the proportion of inhabitants in New Zealand between 1950 and 2050.


Home / Writing Feedback / IELTS 1. The proportion of four different age groups in the total population of New Zealand
ⓘ Need Writing or Editing Help?
Fill out one of these forms for professional help:

Best Writing Service:
CustomPapers form ◳

Graduate Writing / Editing:
GraduateWriter form ◳

Excellence in Editing:
Rose Editing ◳

AI-Paper Rewriting:
Robot Rewrite ◳