Unanswered [1]
  

Home / Writing Feedback   % width   Posts: 2


The proportion of government's money used for roads and transport in Italy, Portugal, UK and USA


honghanh8724 1 / -  
Oct 30, 2021   #1

spending on roads and transport in 4 countries


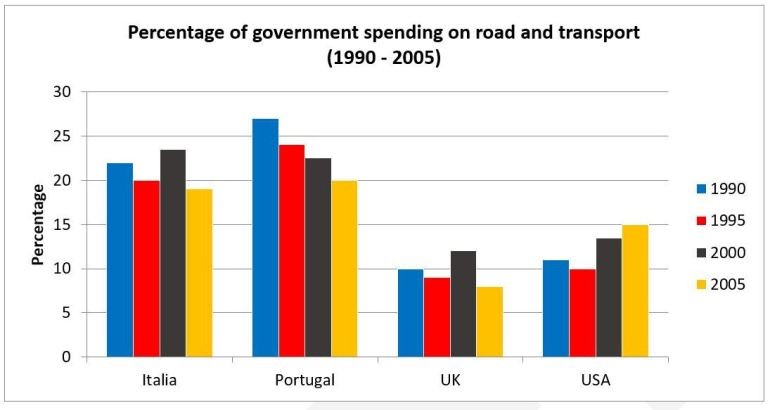
The chart illustrates the proportion of government's money used for roads and transport in Italy, Portugal, the Uk and the US between 1990 and 2005.

Generally, it is clear that there was a decrease in the percentage of government spending for roads and transport in Portugal over a 4-year period, while the figures in the USA increased.In addition, the amount of nation budget used for roads and transport was generally highest in Portugal, while the UK tend to spent the at least amount over the entire period.

Looking at the bar chart in more detail, the percentage of money spent on roads and transport in Portugal reached the highest point at 27% in the first year of this period, and the figures reduced slowly to 20 % in 2005 .In contrast, the figures in the USA started at just over 10%, after which there was a slight rise from 10% in 1995 to 15% in 2005.

In 1990, the government of Italy allocated 22% for roads and transport, which was more than twice greater than that of the UK and the US, at 10% and 11% respectively. The figures grew to 24% in 2000 before it dropped to 19%. The proportion of expenditure for roads and transport in the UK government stood at 10% in 1990 and hit the lowest point at 7% in the last year of the given period after it fluctuated from 1995 to 2000.

  • bar.jpg


Holt  Educational Consultant - / 15512  
Oct 31, 2021   #2
The chart illustrates

The examiner will be looking for the specific chart name/ identifier that will differentiate it from the other types. Familiarize yourself with the image types used to help you better meet the task summary requirements.

Please use at least 2 sentences in the summary overview. Seperate the image identifier and short form data from the inclusive year reference. Avoid single sentence presentations that will result in a GRA deduction.

Generally

The data is not a trending statement but a report paragraph. The tend should only report on the highest and lowest points, without any measurement reference.

The writer is prone to compressed data presentations. The reporting paragraphs are difficult to follow due to the run-on presentations. The paragraphs lack clear analysis points because of the improper sentence formats.


Home / Writing Feedback / The proportion of government's money used for roads and transport in Italy, Portugal, UK and USA
ⓘ Need Writing or Editing Help?
Fill out one of these forms for professional help:

Best Writing Service:
CustomPapers form ◳

Graduate Writing / Editing:
GraduateWriter form ◳

Excellence in Editing:
Rose Editing ◳

AI-Paper Rewriting:
Robot Rewrite ◳