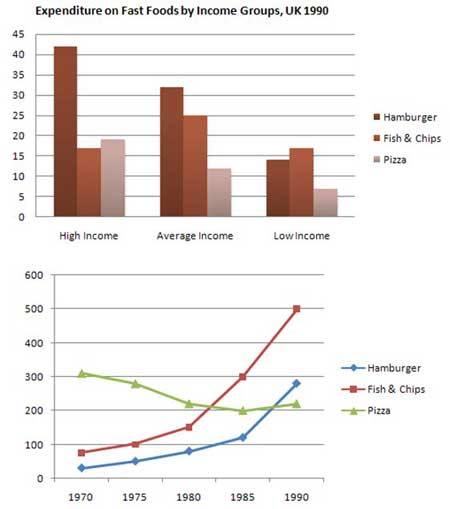
The bar chart illustrates the proportion of money spent on junk food by different income in 1990, while the trend of fast food consumption from 1970 to 1990 in the United Kingdom is presented in the line graph. Overall,except the low level earnings, all rates of income most spent their money on hamburger. In this case, during two decades, hamburger and fish experienced an increase, but pizza saw a reduction.
Comparing the rates of revenue, the expenditure on hamburger predominated in the high-level earnings at more than 40. THIS was followed by pizza at 19, while the lowest rate was seen in fish and chips at approximately 17. Similarly, hamburger still showed its superiority for those earning average and therefore occupied the first place at 32, whereas 25 and around 10 were recorded in fish and chips and pizza respectively. Eventually, people who had low revenue more spent their money on fish whereas the less marked figure was seen in the other fast food.
Turning to the line graph, in 1970, more people consumed pizza, but this decreased slightly by 100 after a decade. meanwhile, having a small proportion initially, both hamburger and pizza saw a gradual decrease in 1980. Then, their figures, at the end of the year showed a stable trend. While pizza remains unchanged at just over 100, a considerable increase by more than double witnessed in the figure for fish and chips. A gradual growth was often seen in hamburger at the year 1990.

mix.jpg
