Unanswered [1] | Urgent [0]
  

Home / Writing Feedback   % width   Posts: 3


WRITING TASK 1- the proportion total expenditure in a certain European country between 1960 and 2000


stella nguyen 1 / 1  
Jun 16, 2021   #1

expenditure proportion in different countries


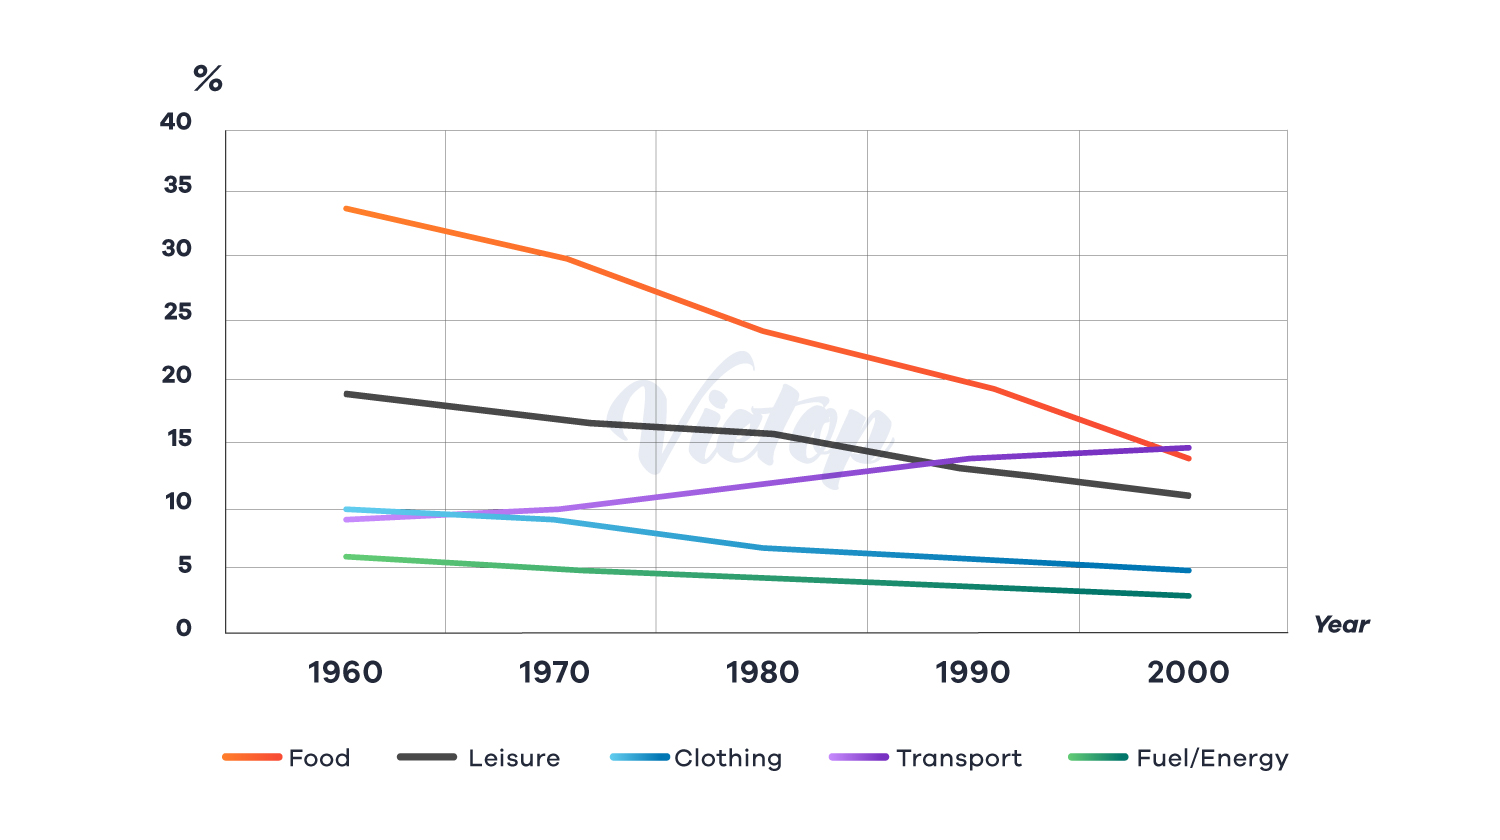
The chart compares the percentage of the total cost for 5 fields in a specific European country over a period of 40 years

Overall, the total expenditure on five sectors increased from 1960 to 2000. In particular, the amount of money for transport rose, while the proportion for food, leisure, clothing, and fuel/energy fell in the whole period of the country

In 1960, the proportion of expenditure on food was highest which accounted for approximately 35%. Around 18% of the money was spent on leisure, but only about 6% on fuel/energy. The figures for clothing and transport was nearly the same, at around one half of that amount of leisure

The biggest change was seen in the proportion of food, which fell steadily over the 40-year period to 15% in 2000. In contrast, the proportion of expenditure on transport rose, reaching nearly 15%, which make the sector be the highest in 2000. The cost for both clothing and fuel/energy decreased slightly, at about 5% and 3% perspectively. Similarly, there was also a drop in the figure for leisure by 10%

  • Picture2.png


Holt  Educational Consultant - / 15385  
Jun 17, 2021   #2
An outline of the 5 represented sectors is a base requirement, along with a proper / complete image identification is a must in the summary overview. This paragraph should contain at least 3 sentences of information highlights from the task. This element is severely lacking in your presentation paragraph. Trust me, the complete presentation matters when considering your work. Had you combined your trending statement with the summary overview, you would have easily met this requirement. As it is, the single sentence does not represent a significant aspect of the summary.

A complete analysis looks for and includes a reference to equal or overlapping data. There in always one reference to that in each image. Here, you failed to analyze the assumed 14% equality in transport and leisure in 1990. An assumption of eqquality statement or analysis is missing from your report.
HelenN 5 / 6  
Jun 18, 2021   #3
Hi @stella nguyen

... on five sectors increased decreased (?) from 1960 to 2000. ... money for transportation rose, while the proportion ... good job on summarizing the trends of each field.

... of expenditure on food was highest ...
... spent on leisure, but only about 6% on fuel/energy. The figures for clothing and transport was nearly the same...

The biggest change ...

=> you can write 3 paragraphs. In the third paragraph, you can compare the numbers in the y-axis (which you have done). Try to combine lines with the same trend as this will help you to write with a better flow.

Comment: I recommend you post the description of the graph so I can check how well you paraphrase it. Good luck! :)
P/s: Ignore the black bold, I just bolded them to follow your idea.


Home / Writing Feedback / WRITING TASK 1- the proportion total expenditure in a certain European country between 1960 and 2000
Need Writing or Editing Help?
Fill out one of these forms:

Graduate Writing / Editing:
GraduateWriter form ◳

Best Essay Service:
CustomPapers form ◳

Excellence in Editing:
Rose Editing ◳

AI-Paper Rewriting:
Robot Rewrite ◳

Academic AI Writer:
Custom AI Writer ◳