Annual Energy Outlook report
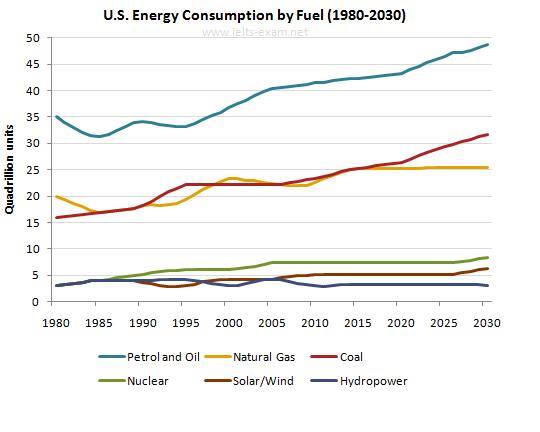
The graph below gives information from Annual Energy Outlook 2008 about consumption of energy in the USA since 1980 with projection until 2030
The line graph of Annual Energy Outlook 2008 shows the rate of U.S. consumption of energy since 1980 with projection until 2030. Overall, there was a gradual increase in three energy sources either in historical trend or in projection, while three other sources remained stable in the year projection. However, Petrol and Oil still remained as the chief source for the US.
To begin, in 1980, energy from Petrol and Oil was the largest number of US energy consumption, which stood at 35 quadrillion, while the second largest was Solar and Natural Gas, at 15 and 20 quadrillion. The least number of consumption in the beginning of period was Nuclear, Hydropower, and Coal. Following the historical years of the period (1980-2015), each of energies experienced a small fluctuation.
Next, in the projecting years of the period (2015-2030), there is a different trend. Petrol and Oil energy, Natural gas, and Solar/Wind energy are projected to rise sharply after 2015, whilst Petrol and Oil energy are still expected as the largest energy consumed by the U.S. Meanwhile, three other energies, Nuclear, Hydro power, and Coal, are expected to remain constant until the last of period.

The_graph_below_give.jpg
