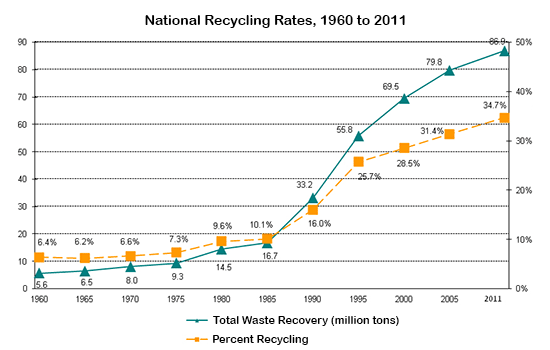
The graph below shows waste recycling rates in the U.S. from 1960 to 2011.
Summarise the information by selecting and reporting the main features, and make comparisons where relevant.
The line graph compares waste recovering and recycling rates in America between 1960 and 2011. It is measured in million tons and percent. Overall, it can be seen that the figure is disapointing compared to total amount at waste being recycle each year and at the same time the total waste recovery and recycling rose simultaneously
In 1960 to 1970, the percentage of waste material being recycled remainly steady at just about 6%. It than rose steady until 1985, about 10%. However, the amount of garbage being recycled triple during the same periode, about 5 million tons in 1960 to 10 million tons in 1985. After this years, the amount of garbage being recycled rose sharply between 1985 and 2011 which is peaked at 86.9 million tons.
Similiarly, the recycling rate continued to rose dramatically from 1985 to 1995, and then grew slightly over the next 15 years untul it reached a peak of 34.7% in 2011.

IELTS_Writing_Task_1.png
