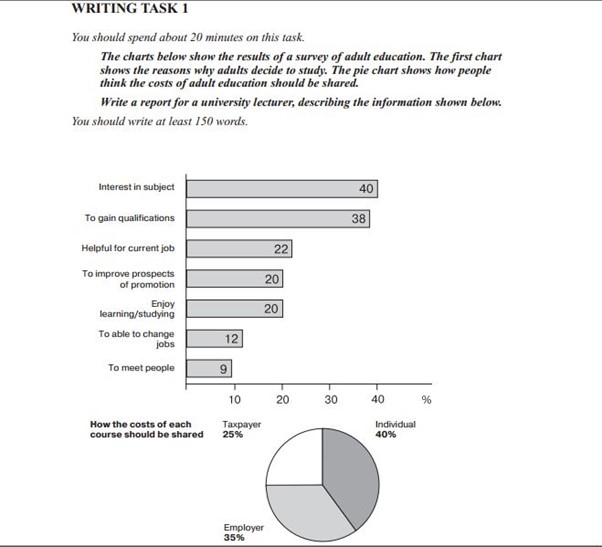
The charts below show the result of a survey of adult education. The first chart shows the reason why adults decide to study. The pie chart shows how people think the costs of adult education should be shared.
Here is my essay:
The charts provide information on the reason why adult population sign up for the course and how such tuition fees should be shared. In general, the most attractive of students to take part in education is interest in subject, and individuals is the main fund of course payment.
Turning to detail, in the bar chart, interest in subject and gain the qualifications top the chart, take up 40% and 38%, respectively. Besides, around 20% adults decide to join the course because it is helpful for current job, improve prospects of promotion and they enjoy learning. Finally, meeting people and change in jobs stand at the bottom of figure and are responsible 9% and 12%.
On the other hand, as can be seen from pie chart, people pay almost thier tuition fees themselves, make up to 40%, followed by employer pay with 35%. Meanwhile, taxpayer occupies over half as much cost as individual does. An interesting feature that purposes of enhancing job prospect and enjoying learning share the same figures of exactly 20% each.
I am thankful for anyone's feedback for me. Thank you very much and have a good day
Write a report for a university lecturer, describing the information shown below.
Here is my essay:
The charts provide information on the reason why adult population sign up for the course and how such tuition fees should be shared. In general, the most attractive of students to take part in education is interest in subject, and individuals is the main fund of course payment.
Turning to detail, in the bar chart, interest in subject and gain the qualifications top the chart, take up 40% and 38%, respectively. Besides, around 20% adults decide to join the course because it is helpful for current job, improve prospects of promotion and they enjoy learning. Finally, meeting people and change in jobs stand at the bottom of figure and are responsible 9% and 12%.
On the other hand, as can be seen from pie chart, people pay almost thier tuition fees themselves, make up to 40%, followed by employer pay with 35%. Meanwhile, taxpayer occupies over half as much cost as individual does. An interesting feature that purposes of enhancing job prospect and enjoying learning share the same figures of exactly 20% each.
I am thankful for anyone's feedback for me. Thank you very much and have a good day

Picture1.jpg
