Unanswered [3]
  

Home / Writing Feedback   % width   Posts: 4


The recorded and forcasted population data and percentage of people aged above 75 years


Hengki Yonathan 4 / 4  
Apr 15, 2016   #1
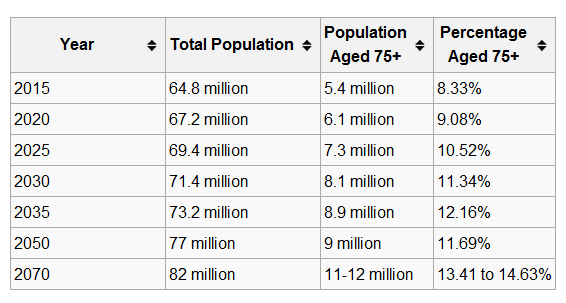
The number of total population and percentage of people aged above 75 years (the older) in United Kingdom, recorded and forcast the data about total population, the older, and the percentage of the older from 2015 to 2070 is illustrated in the table. Overall, it can be seen, 2070 is predicted as the highest of the total and the older population and in fact, the actual last data recorded in 2015 as the lowest rate.

Turning to the prediction data, the highest rate is predicted at 82 million of total population in 2070. Meanwhile, there are a fair similar rate at approximately 9 million of the older population in 2035 and 2050. 2015 to 2035 data is forecast every 5 years then 50, and 70. In 2030, 11,34% indicates less percentage then the prediction before.

In contrast, 2015 experienced the total population 64,8 million with the older percentage 8,33%. Afterward, the predictions forecast a virtually similar rate until 2025 less than 70 million of total population but the older population show much far differentiation from 5,4, 6,1, and 7,3 million for 2015, 2020, 2025 respectively, reaching 10,52% in 2025.

  • UK_Population_aged_7.png


Hadiyati Fudla 9 / 13  
Apr 15, 2016   #2
Hi Hengki! Let me give some suggestion regarding your essay.

1. I think it is better for you to arrange the explanation in sequence. You put 2070 in the second body, but 2015 in the third. It will disturbing the order.

2. The number of total population and percentage of people aged above 75 years (the older) in United Kingdom, recorded and forcast the data about total population, the older, and the percentage of the older from 2015 to 2070 is illustrated in the table.

This starting sentence is a bit confusing. How about this alternative:
" A comparison of the total population and people aged 75+ measured in million, and the percentage of the elder in UK from 2015 to 2070 as a predected year, a 55-year period is highlighted in the table. "
justivy03 - / 2265  
Apr 15, 2016   #3
Hi Rengga, first of all, WELCOME to Essay Forum, I hope, among other writers, you will find this website helpful as well as useful in your future writing practices.

Now, I would like to share a few insights to your analysis.

- recorded and fore casted in the - the older, and the percentage
- of the older generation from
- seen,that 2070 is
- last( you don't have to specify an established idea )

- of the total population
- there areis a fair similar
- forecasted every 5 years, then
- thenthan the prediction before.

- In contrastOn the contrary ,
- much far differentiationdifference from

There you have it Rengga, I hope the corrections help and I wish to see the revision soon.
Lunazimnavi11 4 / 5  
Apr 17, 2016   #4
Hei Hengki. I will give a suggestion to paraphrase:

The number of total population and percentage of people ...

The statistics of population and percentage of people aged above 75 years (the older) based on total population in UK from 2015 to 2070 is figured in the table.

Turning to the prediction data , the highest rate is predicted at ...

In the beginning of the body paragraph, I think it is not suit to use the transitions.
In 2070, total population will reach 82 million while the number and percentage of the older will be predicted at 11-12 million and 13,41 to 14,63 per cent.


Home / Writing Feedback / The recorded and forcasted population data and percentage of people aged above 75 years
ⓘ Need Writing or Editing Help?
Fill out one of these forms for professional help:

Best Writing Service:
CustomPapers form ◳

Graduate Writing / Editing:
GraduateWriter form ◳

Excellence in Editing:
Rose Editing ◳

AI-Paper Rewriting:
Robot Rewrite ◳