Unanswered [2]
  

Home / Writing Feedback   % width   Posts: 9


[IELTS] Task 1 School Spending - Feedback


muffle 3 / 12  
Sep 8, 2013   #1
Hope to receive feedback(s) from everyone. I'm working hard to improve my writing skill.

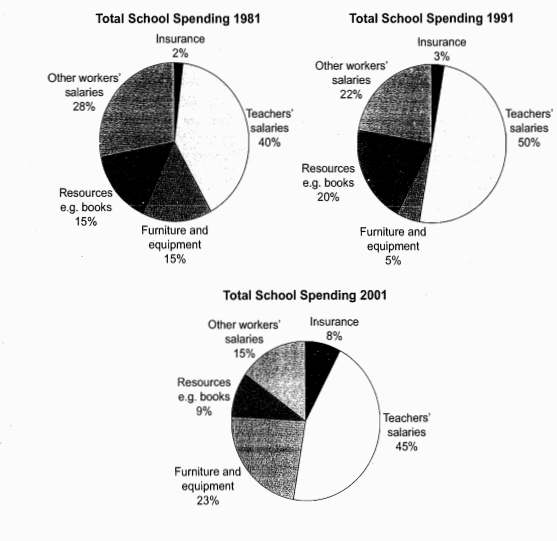
These are pie charts that show the proportions of yearly expenditure on different things in a UK school in 3 separate years: 1981, 1991 and 2001.

The upshot of the charts is that there was a downward trend in spending on other staffs' wages and resources such as books, which stands in clear contrast to other school expenditure.

It is difficult not to notice that teachers' salaries constituted the largest proportion of school spending over the period. The amount of money paid for teachers rose dramatically, reaching 50% of total spending in 1991, ending at 45% in 2001. The 1981 to 2001 period witnessed a fall from 28% to only 15% in expenditure on other workers' salaries.

Resources such as books had cost school spending 20% by 1991 before declining to 9% by the end of the period. A contrasting development took place in spending on furniture and equipment, where expenditure increased slightly from 15% to 23% of total spending between 1981 and 2001. Similarly, the cost of insurance saw a rising trend, growing from 2% to 8% by 2001.

  • 892013.png


MisterWandering 18 / 314  
Sep 8, 2013   #2
These are pie charts that show

The pie charts illustrate

The upshot of the charts is that

Overall

there was a downward trend in spending on other staffs' wages and resources such as books, which stands in clear contrast to other school expenditure.

Overall, teachers' salaries occupied the highest proportion of total expenditure in three given years. Likewise, there was a decrease in the percentage of spending on other staffs' wages and resources such as books.

It is difficult not to notice that

It is obvious that

had cost school spending 20%

accounted for 20% of the school's expenditure
sistan 2 / 3  
Sep 8, 2013   #3
In my opinion, it would be better if you start it with a simple and very small introduction and end it again with a conclusion.

You only need to mention two point from the chart and it really enough for the writing,
Try to make it more fluent, I mean that write it in a way that it won't look discrete, for example use in addition to connect two paragraphs.

The words, specially adverbs, are good enough ;) at least to me!

Hope this helps
OP muffle 3 / 12  
Sep 8, 2013   #4
The pie charts illustrate

Overall

Try to shorten the sentence, right? Can I have a reason why I should do so?

Overall, teachers' salaries occupied the highest proportion of total expenditure in three given years. Likewise, there was a decrease in the percentage of spending on other staffs' wages and resources such as books.

It is obvious that

If I follow your overview which already mentioned about teachers's salaries as the largest proportion, I don't need to mention it in the first sentence in #3 paragraph again?
MisterWandering 18 / 314  
Sep 9, 2013   #5
Try to shorten the sentence

I think you should use simple words rather than complex phrases when writing this kind of task. Keep it simple and clear.

I don't need to mention it in the first sentence in #3 paragraph again

No. I think teachers' salaries taking up the majority of total expenditure is the most noticeable feature of the chart and it needs to be stated in the "overall" paragraph. In the next paragraph, you could mention it again, but in a more detailed way with figures.

I hope this helps!
OP muffle 3 / 12  
Sep 9, 2013   #6
To MisterWandering:

Thanks a lot for your correction and helpful comments. Is the rest of the report fine? I'm wondering if the comparison between changes of different items is good enough.
septem1821 3 / 24  
Sep 9, 2013   #7
Intro:These are pie charts that show the proportions of yearly expenditure on different things in a UK school in 3 separate years: 1981, 1991 and 2001. ---------
a) these are pie charts----the given three pie charts
b) as they mentioned three years--so we can use, the change in total expenditures over three decades during 1981-2001.
c) on various divisions of school in UK
So, here is my introduction: The given three pie charts depict the change in total expenditures on the mentioned school elements during 1981-2001 in UK.

Body: we have to choose two ways to express the content:
here, according to years a) 1981--1st para
b) 1991--2nd para
c) 2001--3rd para
(OR)
according to the mentioned school elements--write in accordance with their proportions and express their variations--high to low ( teachers' salaries-insurance)

Conclusion--is not mandatory but it is good to write.

sorry, if it doesn't help you.
pijiuwdw 6 / 7  
Sep 11, 2013   #8
I think you need a paragraph to conclude your essay and it will make your essay more completed.
OP muffle 3 / 12  
Sep 11, 2013   #9
@pijiuwdw: The conclusion also states the overview again. That's what I have in the paragraph 2.


Home / Writing Feedback / [IELTS] Task 1 School Spending - Feedback
ⓘ Need Writing or Editing Help?
Fill out one of these forms for professional help:

Best Writing Service:
CustomPapers form ◳

Graduate Writing / Editing:
GraduateWriter form ◳

Excellence in Editing:
Rose Editing ◳

AI-Paper Rewriting:
Robot Rewrite ◳