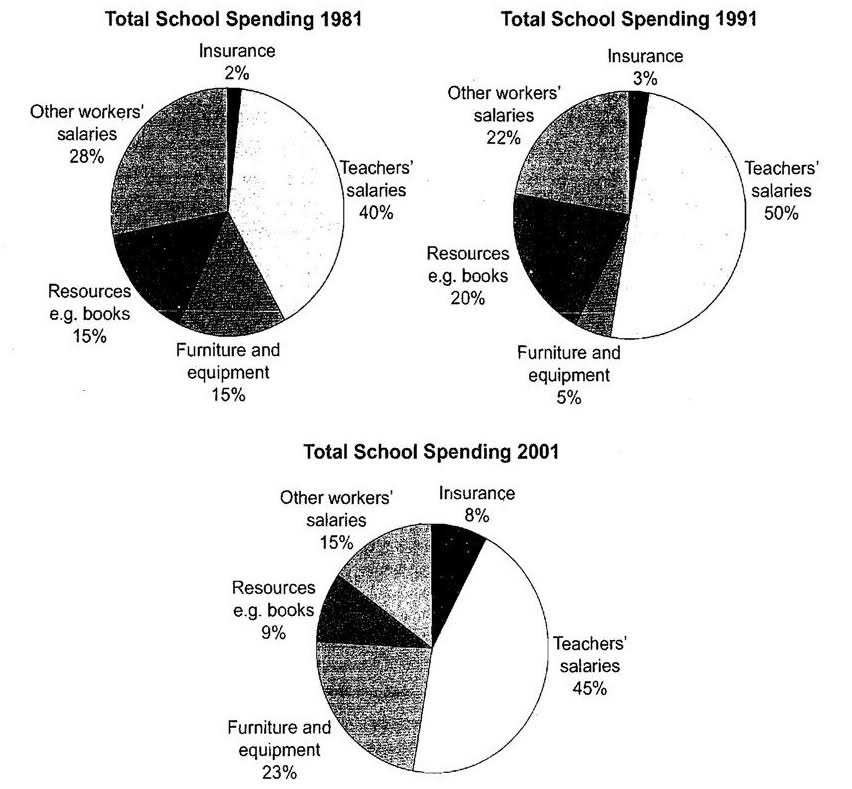
Three charts provided compares the total expenditure including 5 various different amounts of a UK school in three year 1981, 1991, and 2001.
It is evident that there were different changes amongst 5 types of spending in 3 given years.
With 40% in 1981, 50% in 1991 and 45% in 2001, teachers' salaries constituted the highest proportion of total expenditure, whereas insurance accounted for the lowest percentage ranging from a mere 2% to 8%. In contrast with the increase of insurance, other workers' salaries decreased gradually from 28% to 15% in 20 years.
Meanwhile, two other types of expenditure experienced different fluctuations. After a noticeable increase of 5% in 1991, the percentage of spending for resources books dropped dramatically to just under a tenth in 2001. By contrast, the proportion of total amount for furniture and equipments witnessed a sharp fall of 10% in the first ten years, then surged to under a quarter in 2001.

124ga5c.jpg
