Level of education of Bulgarians planning to leave Bulgaria
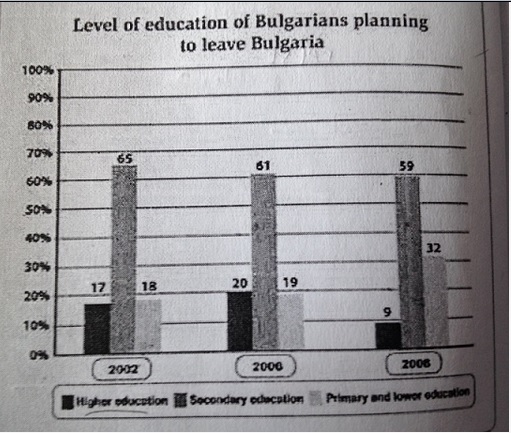
The graph chart reveals comparison three the percentage of Bulgarian education who wanted to live in another country in 2002,2006, and 2008. Overall, it can be seen that the number of secondary education has been in the top position which the most Bulgarian prefer to choose that.
Based on data, there are three categories of education and the proportion of secondary education became the highest in all of the years which stood at 65% in 2002 and slightly decrease to 59% in the six years later. Then, there was a fluctuation in the number of higher education of Bulgarians planning started at 17 percent and it increased by 3 percent in 2006, also it fell down more than double to 9 percent in the last year.
Interestingly, still there was an increasing trend in the percentage of primary and lower education category which stood at 18% and it improved by 1% in four years, a significant improvement was shown to 32% in 2008.

education_planning.j.jpg
