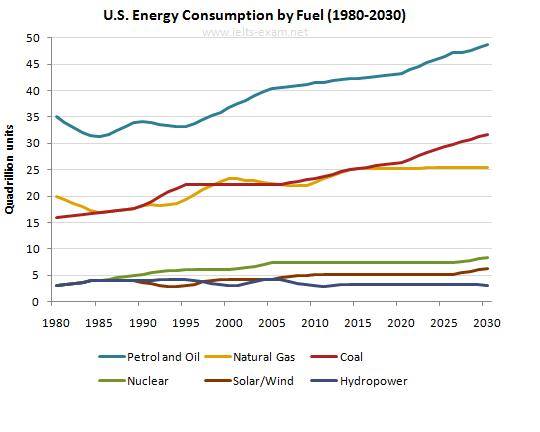
The graph below gives information from Annual Energy Outlook 2008 about consumption of energy in the USA since 1980 with projection until 2030
The line chart illustrates the changes of several kinds of fuel consumed by American citizens per year from 1980 to 2030 as a projected year, a 50-year period and is measured in quadrillion units. Overall, it can be seen clearly that energy produced from petrol or oil was by far the largest consumption over the period. Next, the use of non-renewable energy was more dominant than renewable energy.
To begin with renewable energy, the use of energy generated from petrol and oil stood at 35 in 1980 and fluctuated until 1998. Subsequently, it increased significantly to 40 in 2005 and was predicted to finish at 50 in the end of period. The figure for natural gas and coal showed almost a similar trend to the former. The consumption of energy derived from natural gas fell to around 17 in 1985 but during the following six year, this rose dramatically to 25. Afterward, it will remain stable until 2030. By contrast, energy used from solar/wind was forecast to incline considerably over the same period in which it climbed by 16 from 1980 to 2030.
Turning to non-renewable energy, the number of energy from nuclear, solar/wind and hydropower consumed was equal at 3 in the early period. While the energy from hydropower and solar/wind will be unchanged throughout the time period, nuclear experienced a slight rise and will continue to went up until 2030.

12592230_10206057706.jpg
