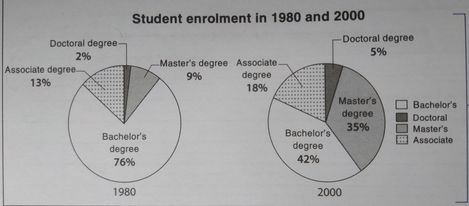
the proportion of students pursuing different degree programs
Topic: The chart below show changes in student enrolment by degree at a university in Canada in 1980 and 2000.
Summarize the information by selecting and reporting the main features, and make comparisons where relevant.
The pie charts illustrates the percentage of students pursuing specific types of degree at a university in Canada in 1980 and 2000.
Overall, it is clear that most students were studying for a bachelor degree in1980 and 2000. Also, the percentage of students enrolled in other 3 degree programs increased during 20 years period.
To specify, the proportion of bachelor's degree students, which accounted two thirds of the total in 1980, plummeted sharply to 42% in 2000. Even though the share of bachelor degree students decreased, it still remained the category with the highest percentage of student enrolment. However, the proportion of students who pursued associate and doctoral degrees occupied at 13% and 2% in 1980, went up to only 5% and 3% in 2000, respectively.
Similarly, in 1980, the percentage of master's degree students made up at 9%, before sharply surged to 35% in 2000.

h.jpg
