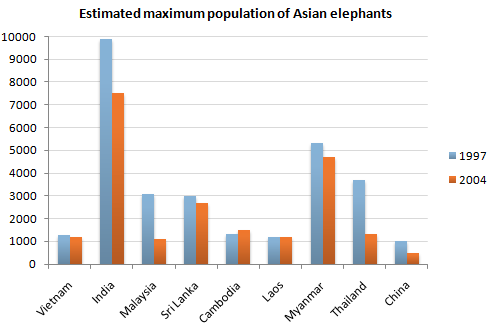
The graph illustrates the estimated population of Asian elephants in nine countries in 1997 and 2004.
India had the greatest population of animals throughout the period but also experienced a drop of over 30% to about 7400 animals in 2004. The second largest population of elephants could be seen in Myanmar where it declined from 5200 to 4600. This is a very small decline compared to the figures of Thailand, where the number of elephants fell by two thirds. A similar pattern could be seen in Malaysia. Here the number of animals decreased from 3000 to slightly over 1000. In Sri Lanka the population dropped by 10% to 2700 animals in 2004.
Cambodia was the only country to experience a growth in the population of Asian elephants. Here the number rose from 1300 to 1400. In Laos the population remained constant at 1600. Vietnam experienced a slight drop in the number of animals, while in China it halved.
Overall, in all countries except Cambodia and Laos there has been a decrease in the population of Asian elephants, with the most significant drops seen in Malaysia, Thailand and China.

IELTS_Writing_Task_1.png
