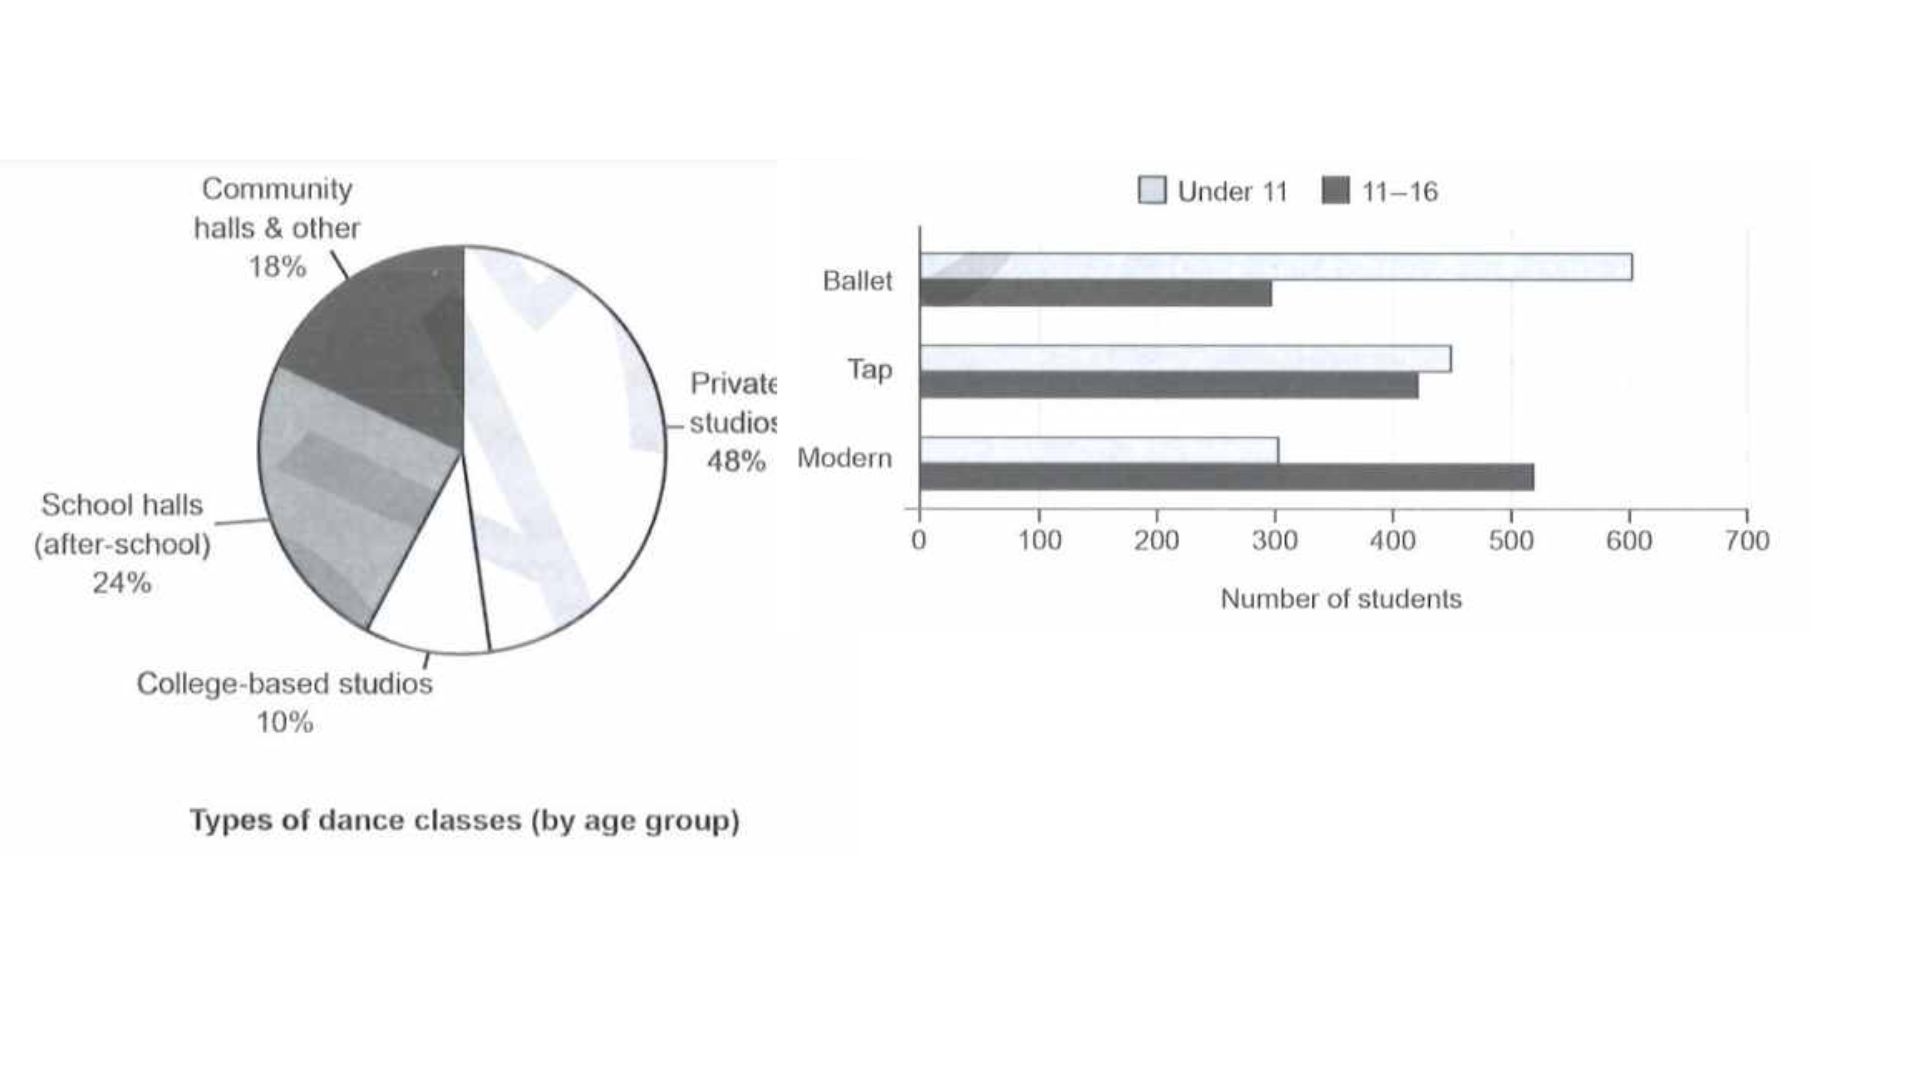
The graphs illustrate the proportion of different learning venue types and the amount of youngsters taking up dance lessons.
It is apparent that private studios are the more preferable choice compared to other communal counterparts in regard to class location. Among those classes, though ballet classes attract the most amount of children, the difference in the total number of each type is not noticeable. The under 11 bracket seem to dominate the 11-16 group in terms of quantity in most classes, except for modern dance.
In regard to class venue, the majority of dance lessons take place in private studios (48%), 2 times higher than the second most prominent one . Coming right under school hall is community halls and others with 18%. And the position of least chosen location belongs to college-based studios, which only account for 10% of the overall amount, about ⅕ of that of private studios.
Concerning student numbers, all three dance classes both record the figure ranging from 800 to 900. In ballet class, there are about 600 under-11 children, 2 times higher than the amount of the older group. The tap class also witnessed the dominance of the younger bracket, nonetheless, the gap is much smaller, about 20 students. Only in the modern dance class does the figure of 11-16 groups exceed that of their smaller counterparts. There are only about 300 under 11 students, a humble number when compared with more than 500 teenagers participating in modern class (approximately 2 times higher).

Untitleddesign.jpg
