Unanswered [2] | Urgent [0]
  

Home / Writing Feedback   % width   Posts: 5


Supervisor vs co-employees - the graph show about result of survey to employee


kurnia 4 / 3  
Dec 8, 2016   #1
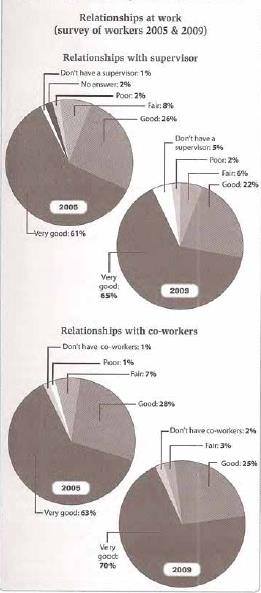
The graph show about result of survey to employees regarding their activity involves with their supervisor and co-employees in 2005 and 2009. The most significant facts to emerge from the pie graph are that employees who answer very good become the biggest result according that survey, and there was a slight increase in 2005 and 2009.

As can be clearly seen, that in 2005 employees who do not have a supervisor and also co-employees are equal only 1 percent. In addition, who answer fair has a few different. Moreover, in 2009 who answer do not have supervisor and co-employees increased slightly, otherwise who answer fair was dramatic fell.

From the graph, as we know most of employees has tend to has good relationship with co-employees than supervisor, it was showed from answer which were resulted very good and good where co-employees was higher than supervisor in 2005 and 2009.
yika 6 / 11  
Dec 8, 2016   #2
Hello Alfin, this is my correction for you

The graph showshows about the result

result according to(remember, you miss the prepositionafter "according")

otherwise who answer fair was dramatic fell.fallor you can write fall dramatically

... most of employees has tendtended to (remember the past participle)

answer which werewas resulted (the subject "answer" is singular noun)

thank you
ichanpants89 16 / 742  
Dec 8, 2016   #3
The missing picture of the task given would not help us in reading and checking the content of your report summary of IELTS task 1. I would suggest you to upload it next time or you might get suspended if you keep making the same mistake.

However, with regards to your essay, I might say that it can only reach overall 4 or even worse in the actual test. First, it didn't answer the task properly. The task clearly tells you that you need to write at least 150 words but you wrote only 149 words. Thus, in terms of Task Response, you can just get 4. Second, only some of your sentences are accurate but errors are predominate. This is why you cannot go more than 4. For the other two criteria (Coherence and Cohesion, and Lexical Resource), you are also more likely to get only 4 due to repetitiveness are predominant and your word formations seem improperly placed.

My suggestion is that you need to try to learn step by step. You can try to write an introduction paragraph first. After you master it, you can just move to the second paragraph and third paragraph. It is suggested for you to try to learn more on how to create accurate complex sentences. Most of them are still inaccurate.

(@ika cahyo: be careful of making a "poor" post. Your account is going to be suspended if you only focus on grammatical errors)
UQ17 3 / 3  
Dec 8, 2016   #4
DEAR ALFIN THESE ARE MY CORRECTION FOR HELP YOUR WRITING TASK ONE

First, you should concern to your task question including all features such time signal, details data etc. It is essential because I saw that your answer and your task inappropriate in particular using of tenses. I saw the task shows past but you several answers with present tense. I regard that that is simple but fatal error.

comments
1.The graph show ... >>> the line charts reveal information about.....
2. employees regarding their activities involves with their..
3. employees who did not had a supervisor...
4. also co-employees were equal only 1 percent....
5. otherwise who answered fair was dramatic fell....
Dioba 68 / 97  
Dec 8, 2016   #5
There are several mistakes in your summary.
1.The graph( it only singular, but i get the picture from other summaries that more than 3 pie charts) show about result of survey( too similar with the question)( change with the outcome of examination of people opinions)to employees regarding their activity...

2. In Writing task I, you SHOULD BE write AT LEAST 150 words, your summary only 149 words.
3.and there was a slight increase in 2005 and 2009. --> all of aspects was increase?. i think you give wrong information.
4. Remember, you should use PAST TENSE in your summary,EXCEPTION the introduction sentence.
2005 employees who do did not have had a supervisor
are were equal only 1 percent.
who answer fair has had a few different.
who answer do not have did not had
5. In addition, who answer fair has a few different. Moreover, in 2009 ...

From the graph, as we know most of employees has tend to has good relationship ...
---> it looks like overview sentence as you are not give the percentage each parts and only give general statement without the number from the data.


  • 15357058_12030000103.jpg


Home / Writing Feedback / Supervisor vs co-employees - the graph show about result of survey to employee
Do You Need
Academic Writing
or Editing Help?
Need professional help with your assignments? Fill out one of these forms:

Graduate Writing / Editing:
GraduateWriter form ◳

Best Essay Service:
CustomPapers form ◳

Excellence in Editing:
Rose Editing ◳

AI-Paper Rewriting:
Robot Rewrite ◳