Hi autumn_waltz, there are several comments for your writing :)
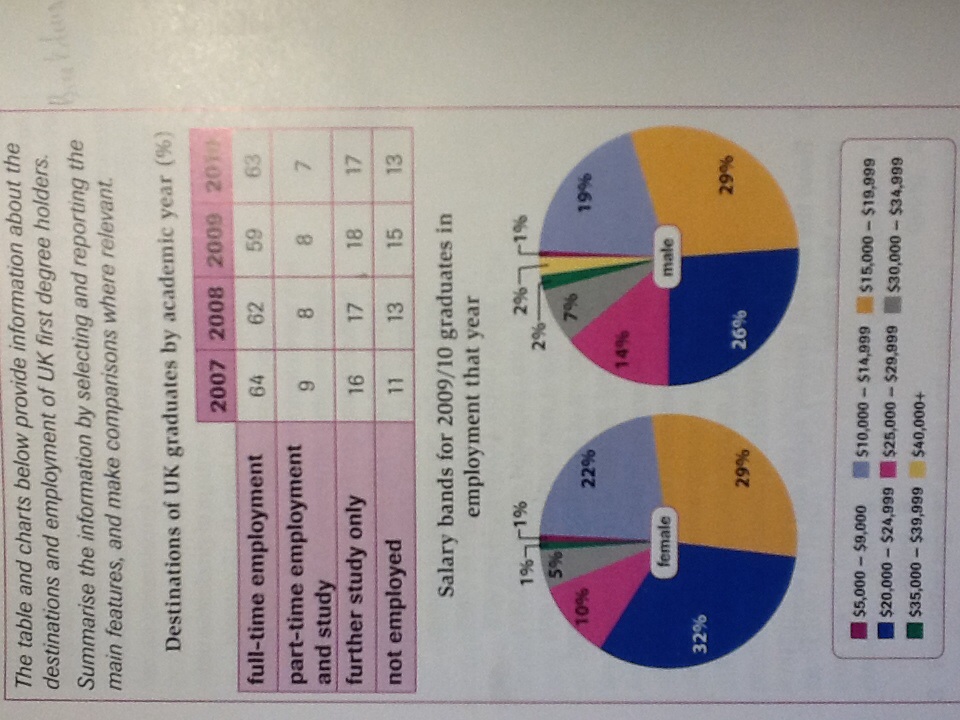
The breakdown illustrates the employment rate from 2007 to 2010 and the wage range of people in the UK (2009-2010) after they finished their Bachelor's degrees. The percentage of employed and not employed graduates is reported in the table, while the amount of salaries of those employed areis presented in the pie charts.
According to the first diagram,in 2010,the proportion of full-time working graduates substantially outweightis much higher than those of people who are not employed or decided to continue their studyingstudy - 63 against 13 and 17 per cent respectively . Meanwhile, the combination of part-time working and study is the least popular option, with the figures decreasingdecreased slightly from 9 percent in 2007 to 7 percent in 2010.
As presented in the second diagram, the salaries of employed graduates varyvaried from $5,000 to $40,000+. The majority (61% of women and 55% of men) earnof women (61%) and men (55%) earned between $15,000 and $25,000. It iswas also noticeable that among those who gaingained salaries above that level, the number of men isexperienced almost twice the number of womenof the women's number - 27% of men compared to 16% of women; moreover, only men arewere recorded to make up more than $40,000 over the period .
It also can be seen that the full-time employment maintainsremained virtually unchanged in its popularity for the first degree holders, with the figures showing only a slight fluctuation between 59 and 64 percentbut overall being consistent . Among employed graduates, men tendtended to earn higher wages than women.
Good Luck. You need to pay attention to the year of the data : is that past, present, or future time?. In addition, I have not seen your overview here, so you also should write it in your writing. Happy writing :)

