Unanswered [1]
  

Home / Writing Feedback   % width   Posts: 3


IELTS Writing Task 1 - Table - Food consumption per person weekly in a European country


Holan 3 / 6  
Sep 2, 2020   #1

table analysis - food consumption


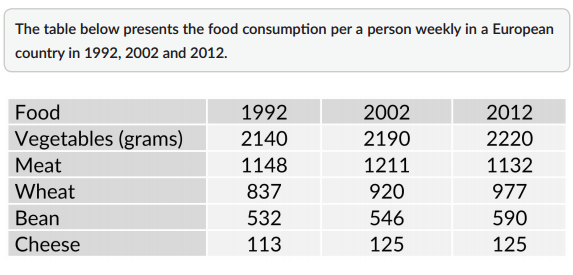
The given table illustrates the number of vegetables, meat, wheat, bean, and cheese consumed weekly in grams per capita in a European country in three different periods of time.

It is clear that while the consumption of meat declined over the period from 1992 to 2012, the opposite was true for other groups of food. In addition, vegetables accounted for the largest portion of people's weekly diet in all three years.

In 1992, vegetables made up for 2140 grams in the total amount of food consumed by a person per week, which was almost double that figure for meat and approximately 21 times as much as that figure for cheese, at 1148 grams and 113 grams respectively. Those figures for wheat, bean, and cheese were 837 grams, 532 grams respectively.

In the next few years, the amount of meat consumed weekly by a person after witnessed a significant rise of 63 grams in 2002, fall dramatically to only 1132 grams in 2012. By contrast, the figures for wheat, bean, and cheese increase marginally to 977 grams, 590 grams, and 125 grams respectively. Similarly, that figure for vegetables climbed up to 2220 grams, remained the highest among these five groups of food.

  • 5typesoffood.PNG


echeveria09 2 / 4  
Sep 2, 2020   #2
I think there are two things that can help you improve your band score:
1. In the first sentence, you wrote: "the number of vegetables, meat, ..." but I suppose it would be more exact if we us "amount" instead of "number"

2. Your paragraph do not have the conclusion, I believe you can make better score by adding the concluding paragraph.
Holt  Educational Consultant - / 15460  
Sep 3, 2020   #3
In the summary overview, you created a run-on presentation that affected the clarity of the information you were presenting. You should use one sentence for the image type, another for the classifications, yet another for the measurement used, and finally, the trending statement. You also made a mistake in the time reference. It does not cover a period from 1992 to 2012. Actually, the chart shows that the report comes from 3 specific years (1992, 2002, 2012). You can confirm this by reading the instruction presentation. It lists the years separately instead of collectively.

Try not to bunch your information into 2 sentences. When doing a comparison, always separate the information into individual sentences so that the clarity of the information is not affected.


Home / Writing Feedback / IELTS Writing Task 1 - Table - Food consumption per person weekly in a European country
ⓘ Need Writing or Editing Help?
Fill out one of these forms for professional help:

Best Writing Service:
CustomPapers form ◳

Graduate Writing / Editing:
GraduateWriter form ◳

Excellence in Editing:
Rose Editing ◳

AI-Paper Rewriting:
Robot Rewrite ◳