Writing Task 1 (the graph is below)
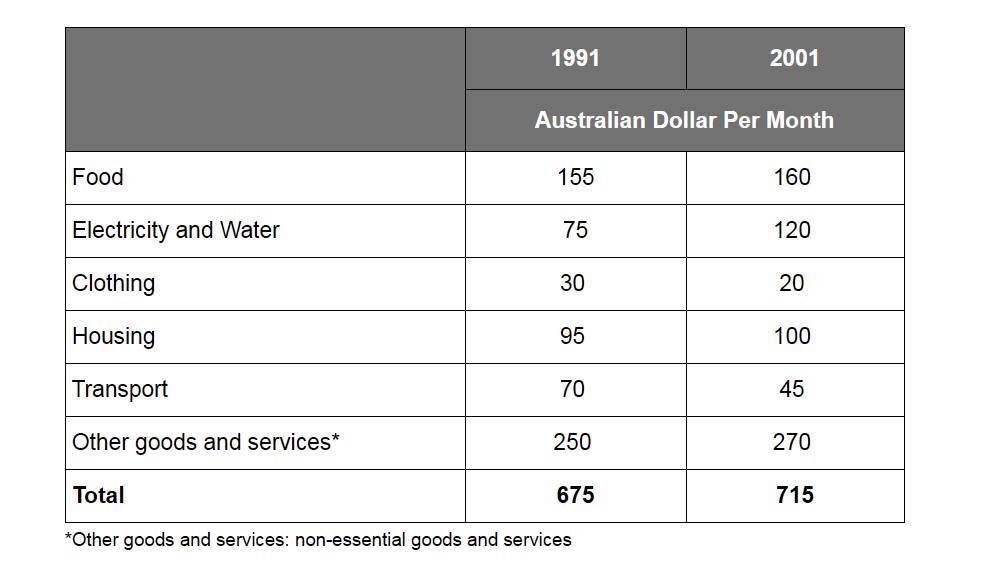
The table below shows the monthly expenditure of an average Australian family in 1991 and 2001.
Summarize the information by selecting and reporting the main features, and make comparisons where relevant.
The table gives information about Australian family in usual monthly expenditure between 1991 and 2001 and is measured in Australian Dollar. Overall, it can be seen the total expenditure in some needs had an upward trend over the period. In any case, other goods and services was the biggest in expenditure while clothing needs was the lowest throughout the period.
Turning first to other goods and services had the highest expenditure at 250 in 1991. As non-essential goods and services, there was a significant rise in the last of period at 270 which was still the biggest. Food and housing had similar pattern which experienced a slow growth in 2001 at only 160 and 100 in order. Surprisingly, electricity and water rose dramatically in the last year at 120.
In contrast, transport witnessed a marked fall at 45 in 2001. In addition, it is evident that clothing was the lowest expenditure over the period which stood at 30 and ended at 20. Totally, the expenditure total showed a gradual increase at 715 throughout the period.

The table
