Unanswered [1]
  

Home / Writing Feedback   % width   Posts: 2


The table and pie chart give information about population in Australia according to different nation


Tlinh31 1 / -  
Mar 24, 2022   #1

different nationalities in Australia


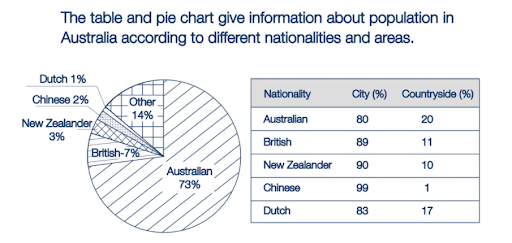
The pie chart illustrates the percentage of people from five nations living in Australia while the table describes the distribution of people in rural and urban areas based on nationalities.

In general, it can be said that the majority of Australia's population are Australian. Moreover, there are more residential areas established downtown than those in the countryside.

According to the pie chart, Australians make up approximately three-fourth of the total population, which is significantly higher than those from other four nations. Dutch is the country which has the lowest citizens living in Australia, only 1 percent is recorded on the chart.

As can be seen from the table, most Chinese people prefer to live downtown rather than in the countryside, followed by New Zealanders with 90 percent in the urban areas and 10 percent in the rural areas. On the contrary, the number of Australians living in the city takes the lowest position among five nationalities while the percentage in the countryside accounts for 20 percent, which ís the highest number of citizens compared to the four remaining nations.

  • unnamed.png


Holt  Educational Consultant - / 15460  
Mar 24, 2022   #2
When writing the summary overview it is important that the information prounded in individualized. It must never be a part of a run on sentence. The word "and" cannot be used as a transition word when dealing with or indicating 2 different sets of information as in those related to a table and pie chart. Though related by topic, these are not related by information. Hence, the need to separate the image presentations.

The general trend as presented only focused on the highs. While acceptable ,the most accurate representation in this paragraph would be a general reference to the highs and lows of each image. This to show a summarized analysis on the part of the writer.

The reporting paragraphs show a lack of sentence development skills in his writing. He has mistaken run-on sentences for complex sentences. The paragraphs are mostly compressed idea presentations that cannot qualify as simple or complex. There should be at least 3 sentence presentations per paragraph. These paragraphs do not come across as trely analyzed due to the sentence format situation.


Home / Writing Feedback / The table and pie chart give information about population in Australia according to different nation
ⓘ Need Writing or Editing Help?
Fill out one of these forms for professional help:

Best Writing Service:
CustomPapers form ◳

Graduate Writing / Editing:
GraduateWriter form ◳

Excellence in Editing:
Rose Editing ◳

AI-Paper Rewriting:
Robot Rewrite ◳