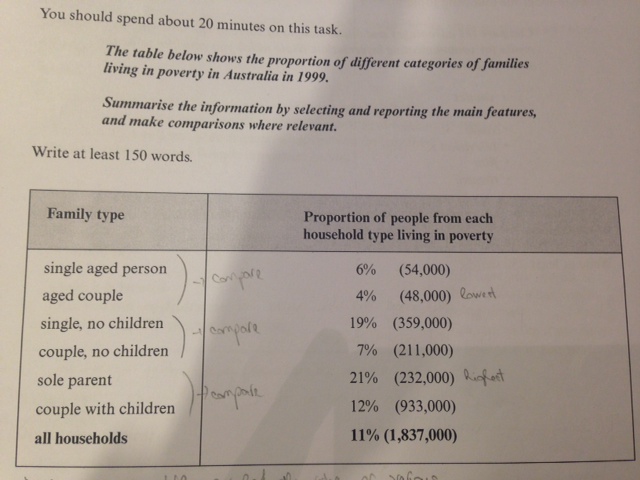
The table below shows the proportion of different categories of families living in poverty in Australia in 1999. Summarise the information by selecting and reporting the main features, and make comparisons where relevant
The graph reveals information about the poverty rates among different types of Australian households in 1999.
It can be seen that people with children were better off than those without children, and single people were less likely to be poor than couples. This rate was exponentially lower among elderly people.
Overall, 1,837,000 Australians (11%) were living in poverty in 1999. Among parents, about 21% of single parents were poor whereas those with children only made up for 12%. The same trend can be seen for people with no children: the figure for single people living below the poverty line was considerably higher than the one for couple, 19% and 7% respectively. Aged people were the least likely to be poor, only 6% for single and 4% for couple.

photo1.JPG
