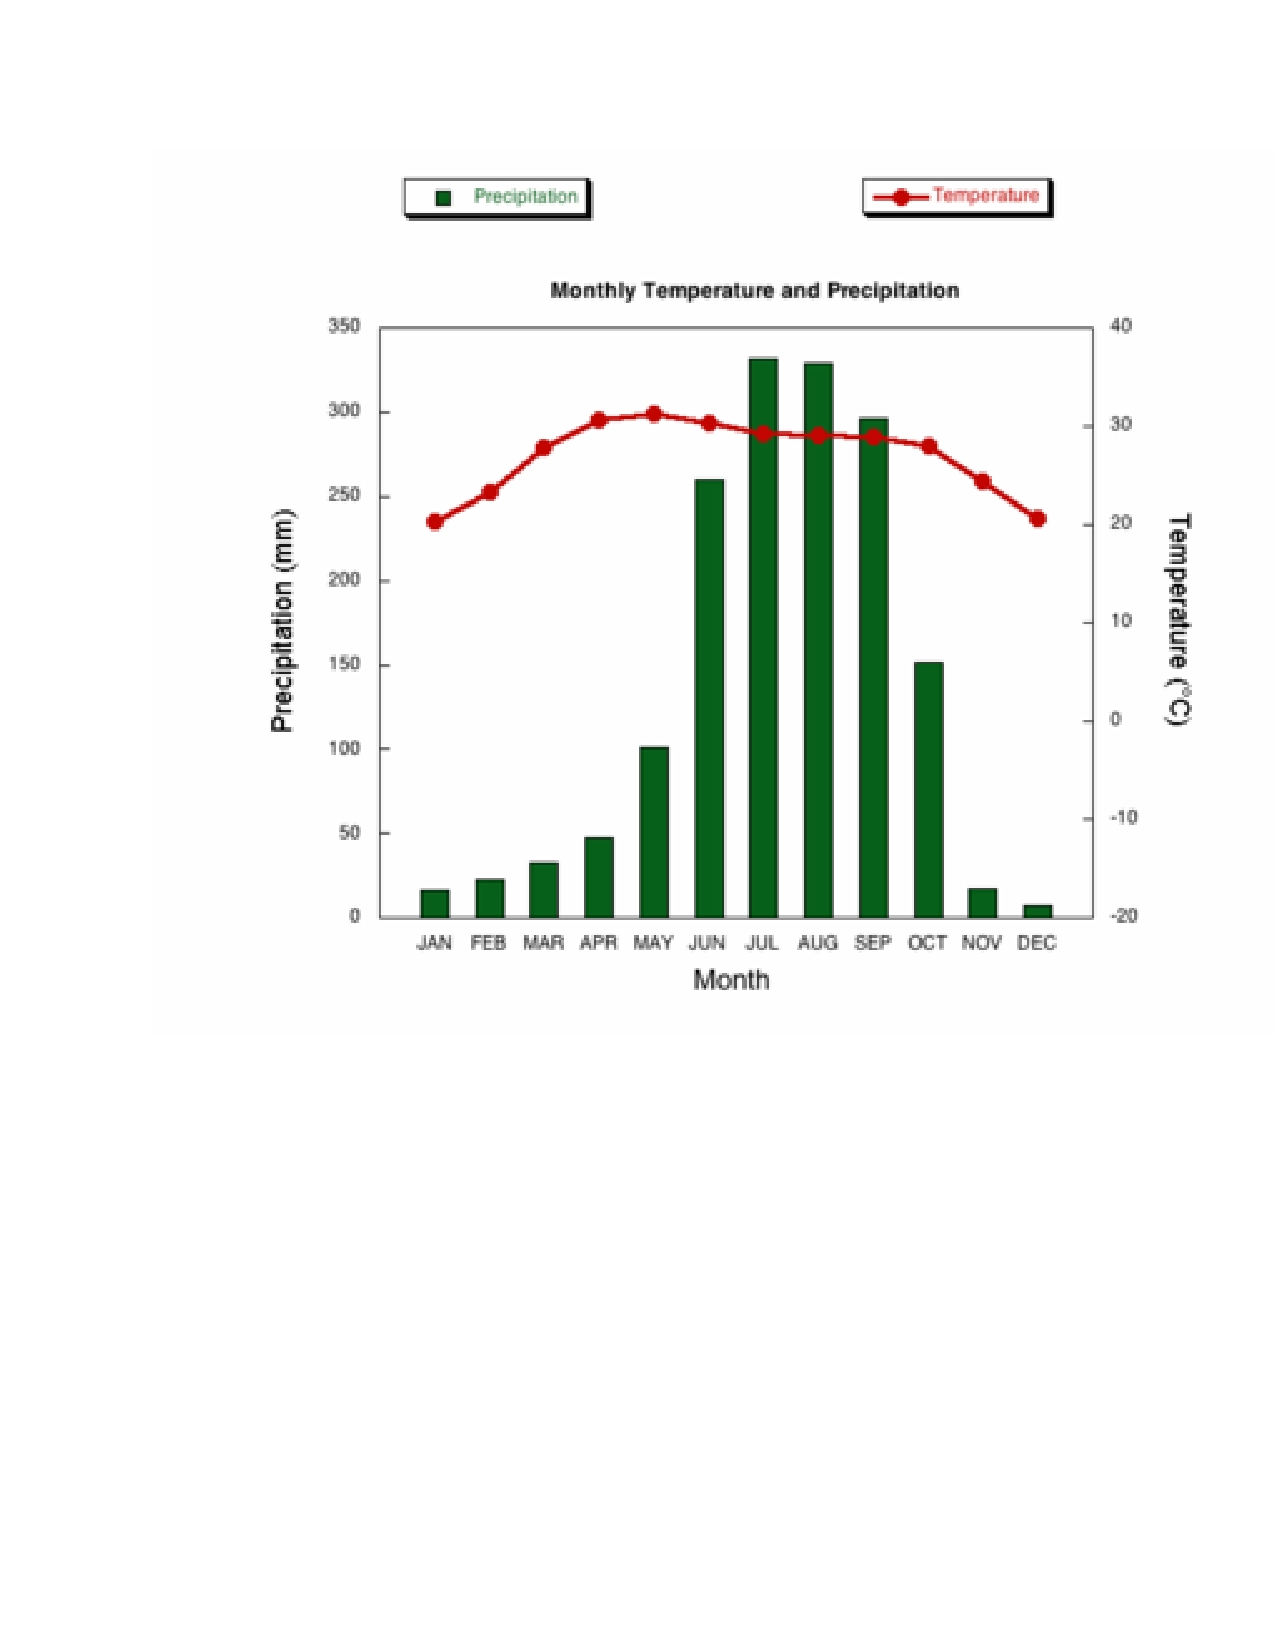
The climate graph shows the number of temperature and precipitation in Kolkata during a particular period of a month.
Overall, the temperature in Kolkata stabled moderately while the downpour take a high percentage in the middle of the year.
As per data, by under 50 mm rain occurs in the first quarter of the year, it gradually increased before rise sharply to more than 250 mm in June. After a short peak period by more than 300 mm downpour occurs in July and August, it has almost halved to 150 mm in October. However, Kolkata region experience the driest period of the overall month by closely to zero rain happen in the last two months.
A closer looked to the curve line, Kolkata temperature' stands the coolest condition in the beginning's year. Appearing 20 Celsius degree it experiences a slight increase to nearly 30 Celsius degree in May. The figures leveling off in the average of 25 degrees before gradual fall to nearly 20 degrees in the end of the year.

Kolkata_temperature..jpg
