EILTS Writing Task 1 Comparing the car theft
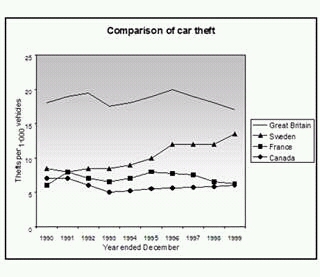
The line graph compares the theft of car in four countries between 1990 and 1999. It is clear from the charts that Great Britain had showed the fluctuation case of car theft and be the highest percentage in 1995. While, Canada had been the least percentage about car theft.
In the period between 1990 and 1995, car theft in Great Britain rose a two percentage from around 17 to 18. During the same period, car theft was dramatical rose in France, to nearly 10, while in Canada and Sweden fluctuated between 6 and 8 in this period.
By 1999, the number of car theft had occured in Great Britain in average had plummeted to around 16, but the car theft in France had rose around a half since 1995s, to approximately 14. By contrast, there were no significant changes in Canada and Sweden over the period as a whole

FB_IMG_1474870158594.jpg
