The title:
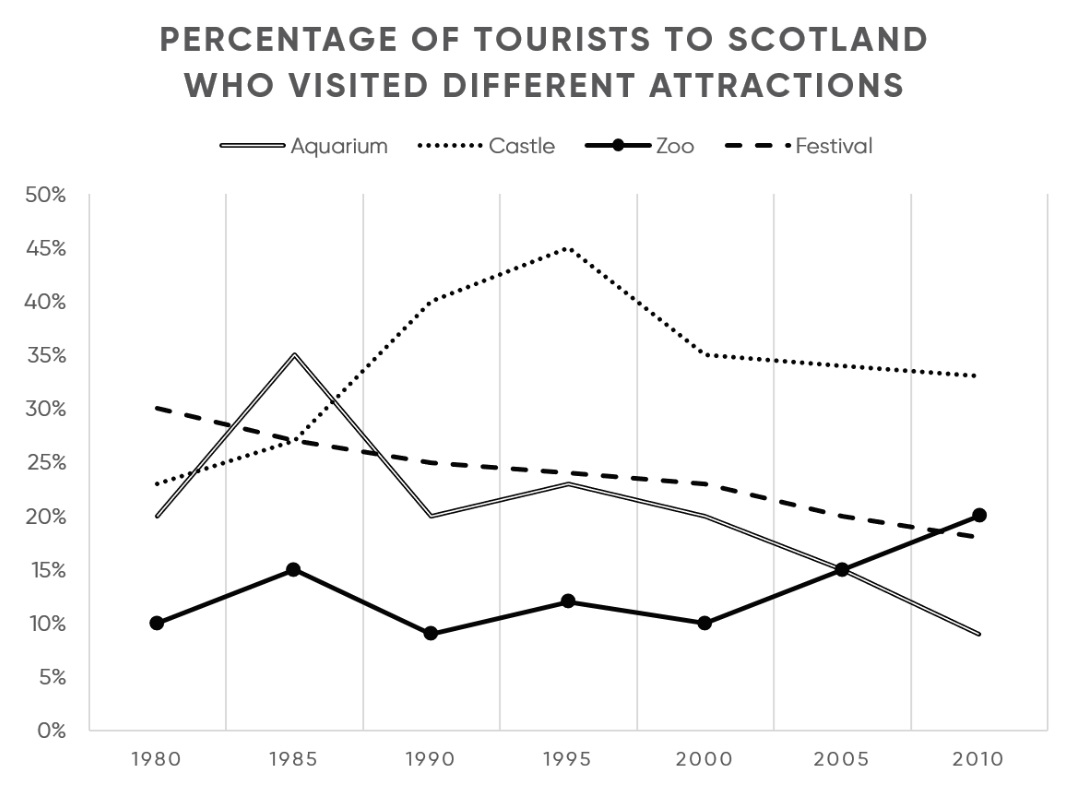
The chart shows the proportion of visitors to Scotland who traveled to different places of interest in 30 years commencing from 1980.
As can be seen, throughout the period, the rate of castle visitors tended to increase. From 1980 to 1995 the finger of castle visitors increased dramatically and reached a pick of approximately 45%. Since 1980 the rate of castle visitors has always remained above 20%. In 1980 the percentage of zoo travelers was 10%. During the period, the proportion of Zoo travelers hovered around 13%.
Looking at others tourist destinations, in 1980, the rate of festival visitors was 30% and the finger of aquarium travelers was 20%. Generally, the rate of both places of interest tended to decrease. Throughout the period the proportion of aquarium visitors fluctuated. Over the period the finger declined by roughly 10%. About the festival visitors, over the period, the rate decreased by just under 20%.
Percentage of tourists to Scotland who visited different attractions.
The chart shows the proportion of visitors to Scotland who traveled to different places of interest in 30 years commencing from 1980.
As can be seen, throughout the period, the rate of castle visitors tended to increase. From 1980 to 1995 the finger of castle visitors increased dramatically and reached a pick of approximately 45%. Since 1980 the rate of castle visitors has always remained above 20%. In 1980 the percentage of zoo travelers was 10%. During the period, the proportion of Zoo travelers hovered around 13%.
Looking at others tourist destinations, in 1980, the rate of festival visitors was 30% and the finger of aquarium travelers was 20%. Generally, the rate of both places of interest tended to decrease. Throughout the period the proportion of aquarium visitors fluctuated. Over the period the finger declined by roughly 10%. About the festival visitors, over the period, the rate decreased by just under 20%.

image_2023_02_21T15_.png
