Hi.., evening everyone
I write the IELTS visual writing. Please gimme your suggestion to improve my: Task Response, Coherence and Cohesion, Lexical Resource and Grammar.
Question:
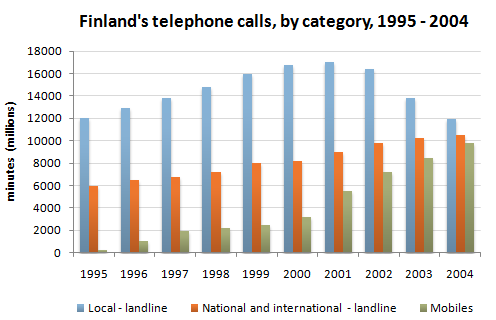
The chart below shows the total number of minutes (in millions) of telephone calls in Finland, divided into three categories, from 1995 - 2004.
======================================
Answer:
The chart provides information regarding the overall time spent by Finland's residents on different types of telephone calls, during a 9-year period, from 1995 to 2004.
In general, the three categories: local, national-and-international landline and mobiles show a parallel increase after a starting point in the first year of the period, although the category of local landline calls decreased slightly towards the end of the period.
Referring to the data between 1995 and 2004, local-landline calls were the highest throughout the period, rising from 12000 million minutes in 1995 to just under 17000 million in 2000. After a short peak at 17000 million the following year, these calls had fallen back to the 1995 figure by 2004. The other significant changes demonstrated to National and international land-line calls grew steadily from 6000 million to 10500 million at the end of the period in question, though the growth slowed over the last two years.
Surprisingly, there was a dramatic increase in mobile calls from 250 to 9800 million minutes. This rise was particularly noticeable between 2000 and 2004, during which time the use of mobile phones tripled.
In the end, if we analyze the data we can see that the gap between the three categories had narrowed considerately over the second half of the period in question, although local land-line calls were still the most popular in 2004.

IELTS_Writing_Task_1.png
