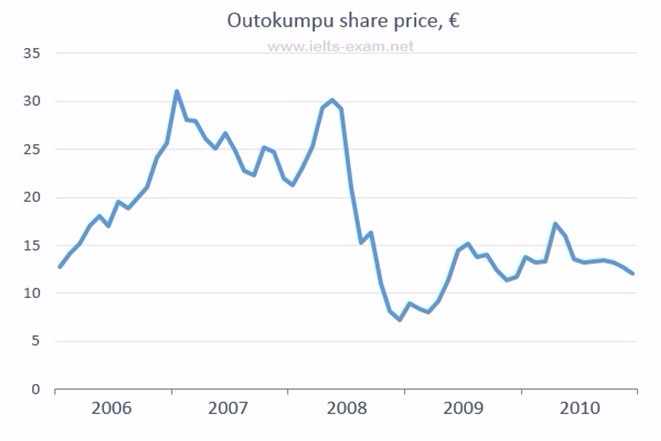
The trend of Outokompu stock price over a five-year period is illustrated in the line chart. The value is measured in Euro from 2006 to 2010. It is noticeable that, despite some fluctuations, the rate reached the peak in the end 2006 and almost virtually the highest score in the middle 2008 before jumped dramatically for the next following years.
Initially, the price stood at around 13 Euros in early January 2006. The share price then rise considerably in early 2007 to peaked at around 31 Euros. However, January to December in 2007 experienced a markedly fall to around 22 Euros.
There was a significant improve during the first semester 2008, then followed by an extreme drop to roughly 6 Euros. During the end of period, from 2009 to 2010, there was a fluctuating amount which is finished by a similar point like the beginning period.

AkHq7TWXk9l5ynxtIKqB.jpg
