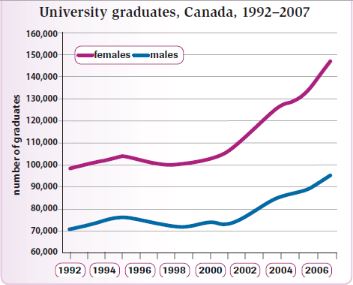
The line graph illustrates about the number of alumni in the Third level Education of Canada over the 15 years period. Overall, the both of figures showed an upward trend and females student was by far most dominant in the total of people.
Initially, by 1992, the widened gap had been seen between both graph. The number of gender alumni experienced slightly increase at 70,000 and 98,000 respectively. In addition the number of people graduated in the 1995 for two figures to 75,000 of men and 150,000 of women. While the changing trend in 1998 experienced slightly drop at 72,000 and 100,000 with two figures.
Between 1998 until 2006, the number of college graduated experienced sharply rise by two gender. In this case, the number had significantly changed by almost 48,000 of men and 25,000 of women. Therefore, the both gap was more widened in the end of the year. Eventually, by 2007 of female reached a peak at around 150,000 in the end of year.

graduate.JPG
